trade1638
Here is a bearish analysis of the gold market, based on current market dynamics and potential risk factors: ### 1. **Short-Term Technical Pressure** - **Key Resistance Level Suppression**: Gold recently faced strong resistance near **$3,374**, with the **0.618 Fibonacci retracement** level on the daily chart acting as a barrier. A failure to break above...
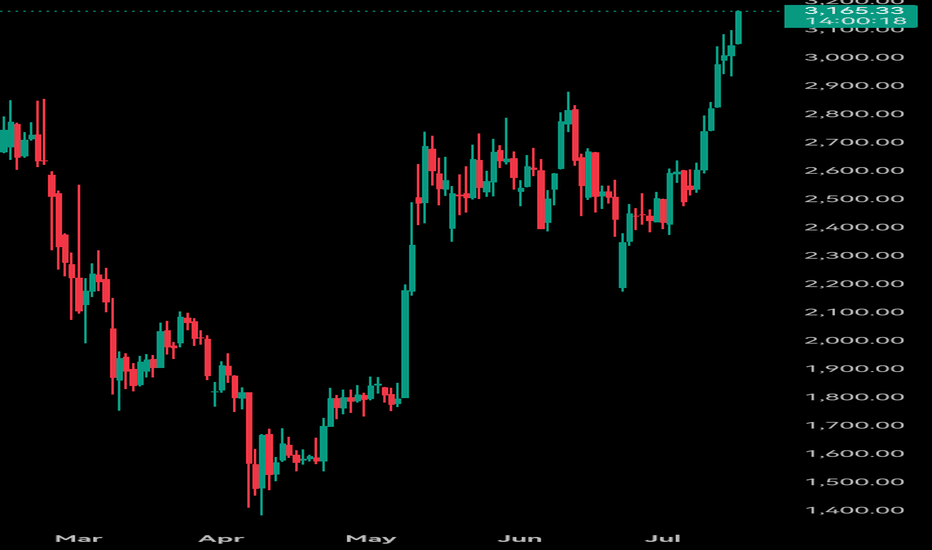
### **Bearish Analysis of Ethereum (ETH)** Here is a bearish outlook on Ethereum (ETH) based on current market dynamics, incorporating technical, liquidity, and fundamental factors: --- ### **1. Technical Resistance & Topping Signals** - **Key Resistance Zone**: ETH has repeatedly tested the **$3,000–$3,080** resistance level but failed to sustain a...
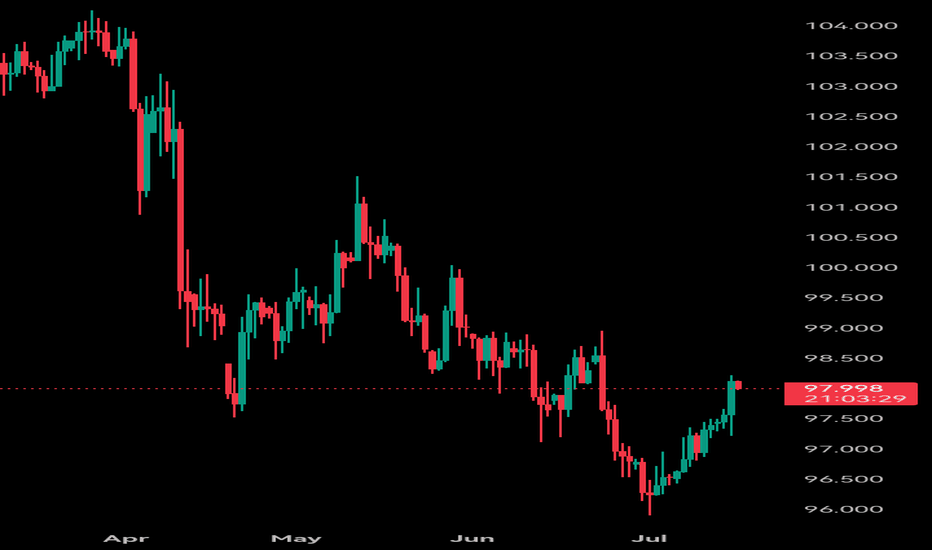
### **Bearish Analysis of DXY (U.S. Dollar Index)** The U.S. Dollar Index (DXY) has recently shown a weak trend, with a prevailing bearish sentiment in the market. The primary factors driving this outlook include: ### **1. Rising Expectations of Fed Rate Cuts** - Recent weak U.S. inflation data (such as May's PPI and CPI) have reinforced market...
china deepseek↓↓ ### **U.S. Dollar Index (DXY) Recent Analysis and Outlook** #### **1. Current Market Trends and Driving Factors** - **Trade Policies Boost the Dollar**: U.S. President Trump recently announced new tariffs on Canada (35%), the EU, and Mexico (30%), triggering risk-off sentiment and pushing the Dollar Index (DXY) from 97.20 to around 98.00. -...
Analysis of the possibility of a high point before a pullback The upper boundary pressure of the local rising range, the whole rising callback is half broken through the rising range and continued to fall, the overall sideways trend
Water point of view, the dollar needs a small shock rise after falling too much, slow down and continue to fall............ It was pulled up to the upper boundary before, and the decline was smooth and fast. What should I do if the decline is too fast? Slow down Continue to see the decline, the trillion-dollar debt of the United States is a big pit, depreciation...
The oscillation interval and the location of the dotted line are indicated by yellow arrows, which are simple oscillation intervals. The main problem is still the drawing technique.
The two oscillation intervals are horizontal oscillation intervals, starting from the far left and sloping downwards. The same principle applies to the oscillation intervals. To go long at the support level, it is important to use a reasonable and correct line drawing method
A simple oscillation range, the controversy lies in the point selection of the upper boundary, and there are still half of the upward targets in the future. Wrong, from the lower boundary to the upper boundary, and then to break through again, there are many upward targets..
The simple two lines determine the historical trend and fluctuation pattern. Hahaha, it's simple, but it requires a correct analysis method
The yellow downward channel has broken through with an upward target marked, and there are also other oscillation ranges. Overall, it is expected to rise, very simple and obvious.
The upper boundary of the white oscillation range is expected to break through and rise in the future. The correct method of drawing lines is important, rising for a day and falling for a week and a half.. tricks. Rising or still rising
Blue uptrend channel, yellow horizontal oscillation range, with the correct line drawing technique starting from the far left. Reasonable drawing of lines.
It is important to draw the line correctly to go long at the support level of the three oscillation intervals.. The white horizontal oscillation interval is interspersed reasonably, the blue horizontal oscillation interval is also independent and does not interfere with each other, and the yellow upward channel is supported by the lower boundary
It is important to draw the line correctly to go long at the support level of two oscillation intervals.. The white oscillation intervals are interspersed reasonably, and the local blue downward channels are also independent and do not interfere with each other
The correct way to draw a line is to extend the cost position of historical capital games. Of course, there are techniques to draw a line, and it is important to go long at the support level
Upward channel, upward oscillation range, lower boundary support position, upward long position, simple line drawing technique, correct line drawing technique
Upward channel, upward oscillation range, lower boundary support position, upward long position, simple line drawing technique, correct line drawing technique


