trade_r_
Bitcoin has made a significant move down from its highs of 60K. Within a short window of time it has lost 50% of its value and historically that doesn't bode well for the future price action. If this was any other asset I would suggest existing it completely but since this is Bitcoin and considering it is a deflationary, I still feel bullish on it long term. My...
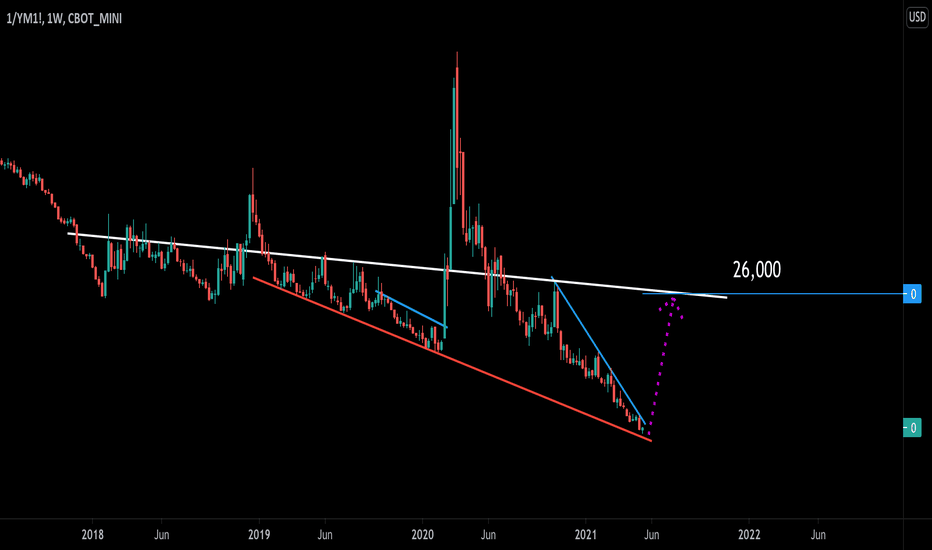
Notice that in the past when price touched the red line it always led to a subsequent move in the opposite direction. Well folks price is now touching that line again. If my statistical analysis plays out we are headed for 26000! I demarcated 26000 as a potential landing zone due to historic S/R that is somewhat visible to the naked eye.
Bag holders are created within Fomo markets, markets that seem to good to be true. I speak as a trader with over a decade of experience when I say that we are looking at a Fomo market developing in Ether. Ether has rejected 2 times off of the resistance line highlighted in blue, once in 2017, once in 2018 and currently we are sitting right below the line. If...
Over the last several years Bitcoin has always reached a zone of supply when entering the area highlighted in red. This red diagonal supply zone is the area where MT Gox'es 2014 top formed, as well as the top in 2018. The current geometry seems to be forecasting a massive move down, with a potential bottom forming around $20,000!
Bitcoin's current price action is matching up very will with the top that formed in the Spring of 2019. Both charts formed two bull flag patterns, followed by a topping inverse W pattern. Also seen within both charts is a distinct accumulation pattern that I have denoted with yellow bars. My call: 20K within the next 3-4 months!


![Its Time To Pay Attention [Bearish Bitcoin Fractal Analysis] BTCUSD: Its Time To Pay Attention [Bearish Bitcoin Fractal Analysis]](https://s3.tradingview.com/w/WJZfU5A7_mid.png)


