tradersboat
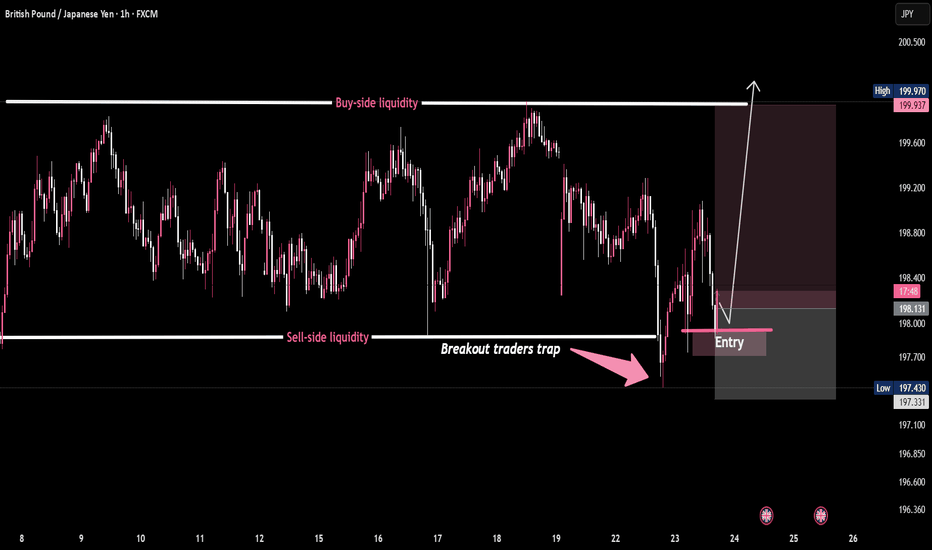
PremiumPrice nuked below range lows to sweep sell-side liquidity, trapping breakout sellers. Smart money scooped it up. Entry reclaimed — now eyeing buy-side liquidity above 🎯 This is how the game is played: 1️⃣ Liquidity grab 2️⃣ Breakout trap 3️⃣ Reclaim & reverse 4️⃣ Target resting orders up top 🚀 📈 GBP/JPY – Classic Breakout Trap in Play 🧠💥
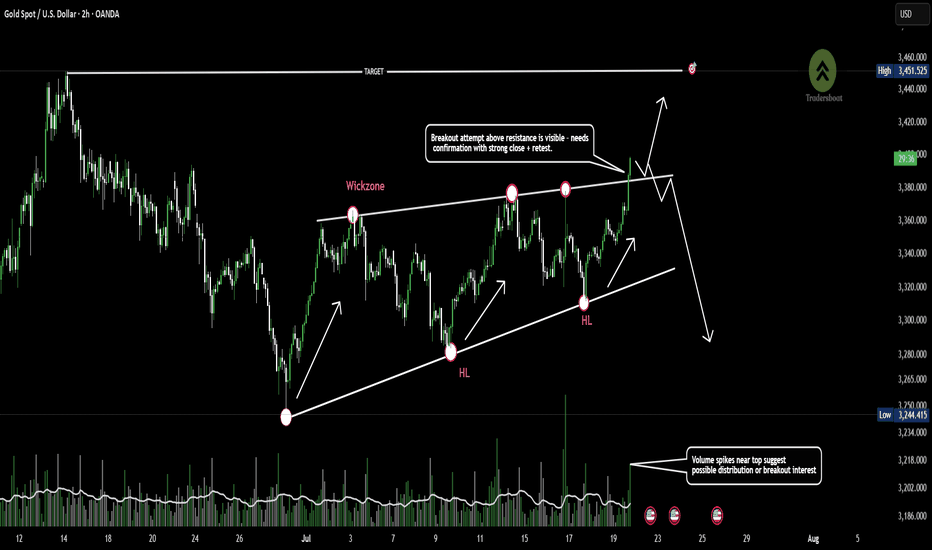
Gold is trading within a rising wedge pattern, showing consistent higher lows and repeated rejections near the 3400 resistance zone. Price is now approaching the upper trendline, an area of prior wick rejections and potential liquidity grab. A confirmed breakout could signal continuation, while failure to sustain above this level may indicate bearish divergence or...
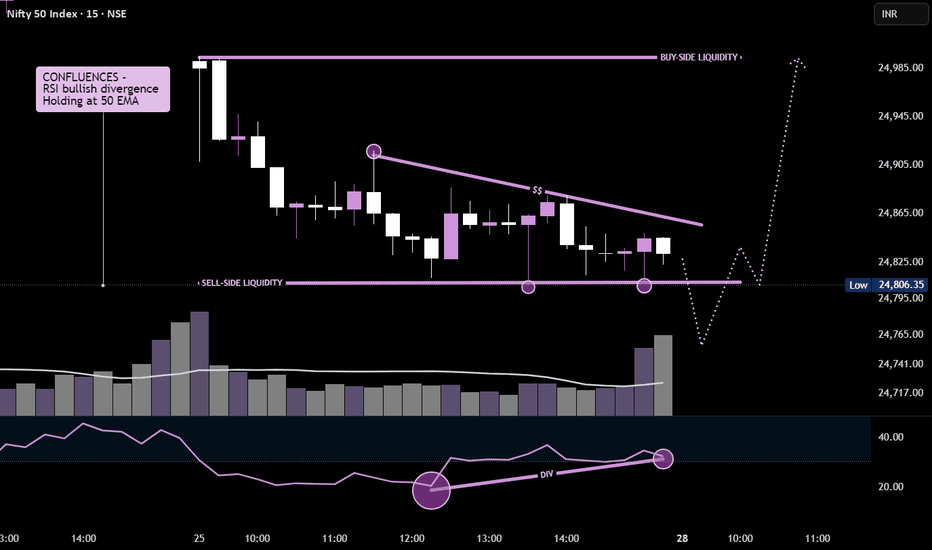
Price is forming a falling wedge pattern with clear bullish RSI divergence, signaling potential reversal.
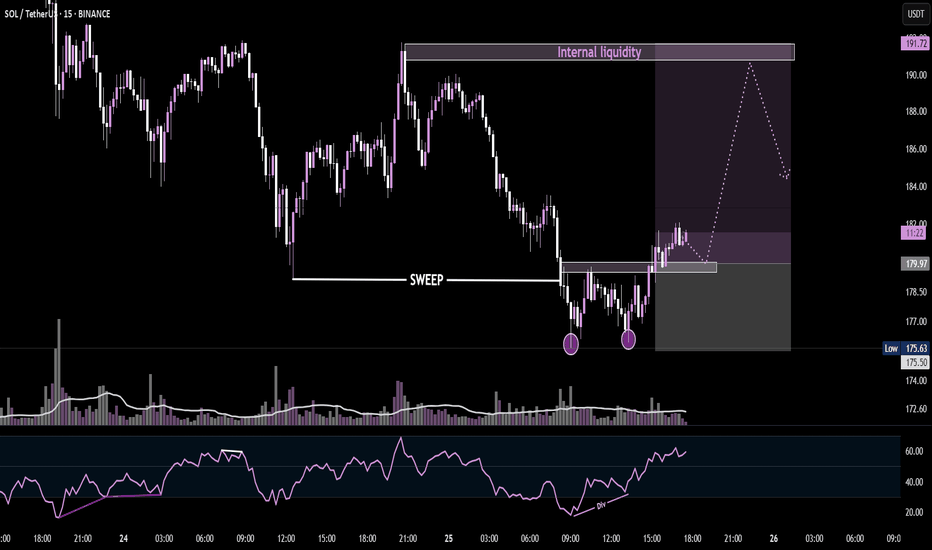
rice swept previous lows, formed a double bottom with bullish RSI divergence, and is now consolidating above the sweep zone. If support holds, we may see a rally into the internal liquidity zone around $191. Keep an eye on structure and volume confirmation for the next leg up.
Gold is targeting an external liquidity zone around 3,450 after breaking structure and forming a bullish setup. Price is expected to dip into the discount zone near 3,300 to collect liquidity from trendline stops before a strong move upward. Smart money is likely hunting below prior lows before initiating the next bullish leg.
Price tapped into a strong resistance zone multiple times, forming equal highs — a classic liquidity pool. After a trendline break and formation of an FVG (Fair Value Gap), price is likely to retest the imbalance before continuing lower. The setup hints at a potential liquidity sweep followed by a sharp selloff toward fresh lows.
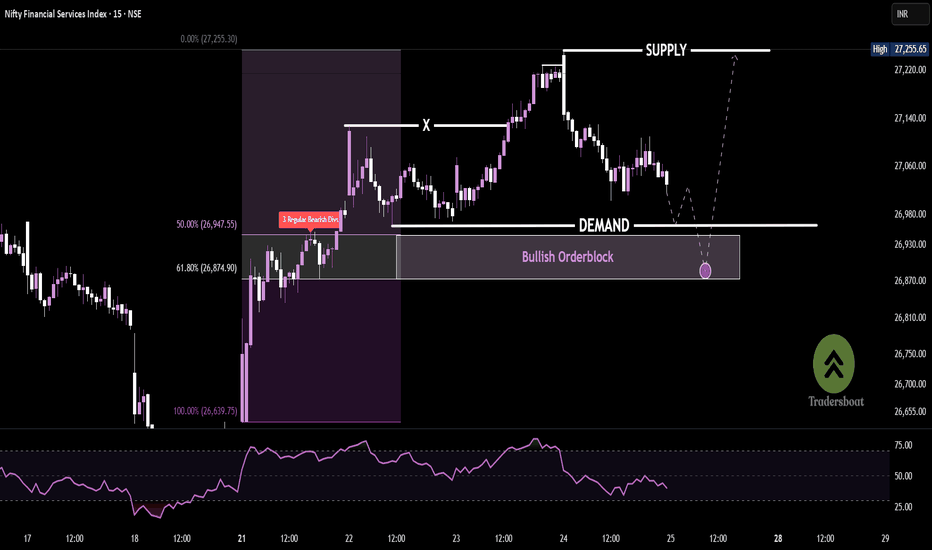
Price rallied from demand, showing strong momentum until bearish divergence triggered a short-term reversal from the supply zone. Now price approaches a bullish order block, aligning with the 61.8% Fibonacci retracement, offering high-probability long entries. A bullish reaction here could fuel a reversal toward the previous high or even sweep the supply zone.
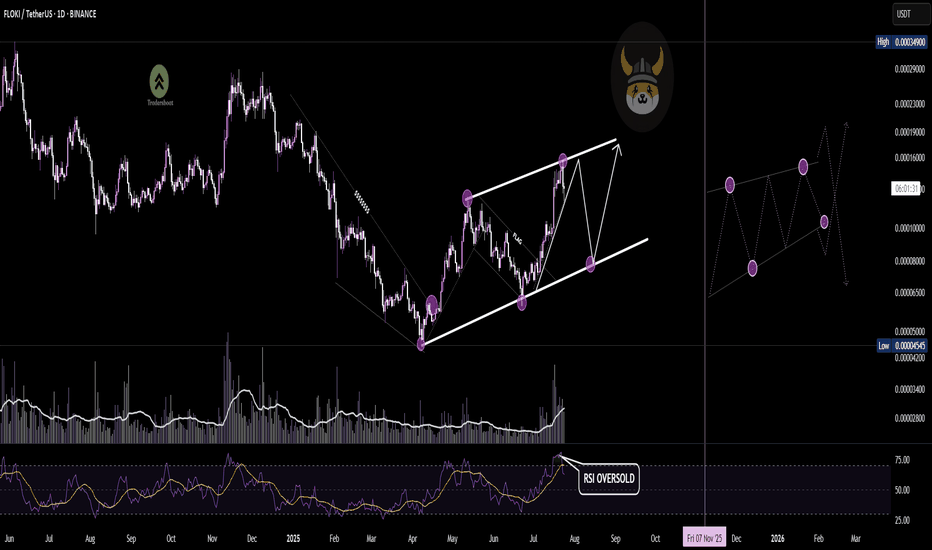
FLOKI/USDT on the daily chart is forming a well-defined ascending channel, respecting both upper resistance and lower support trendlines. The RSI recently entered the overbought zone near resistance, suggesting short-term exhaustion. If price corrects, we could see a move toward the lower trendline, offering a potential long opportunity for another leg higher —...
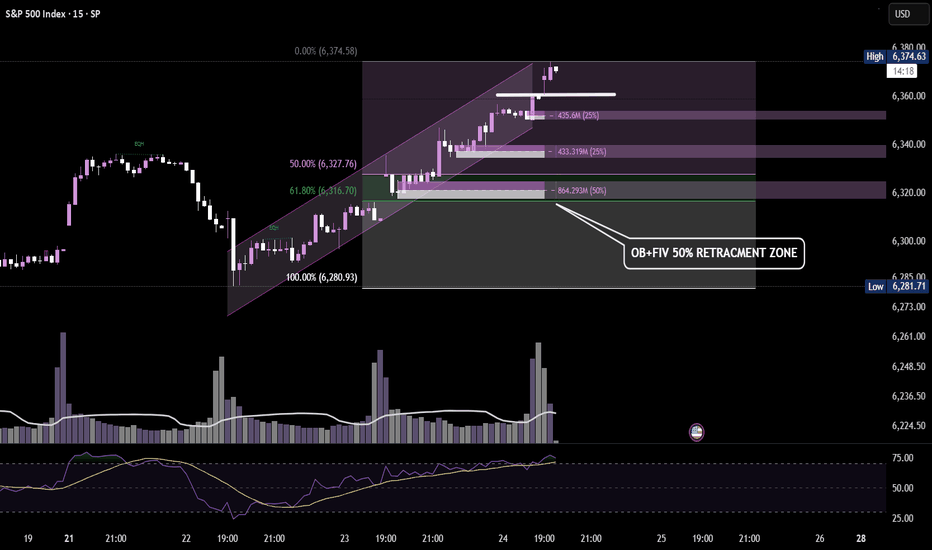
Potential retracement zone aligning with Order Block + 50% FIB. Watching for bullish reaction near 6320–6316 — key confluence zone for a possible continuation leg. 🔁📈
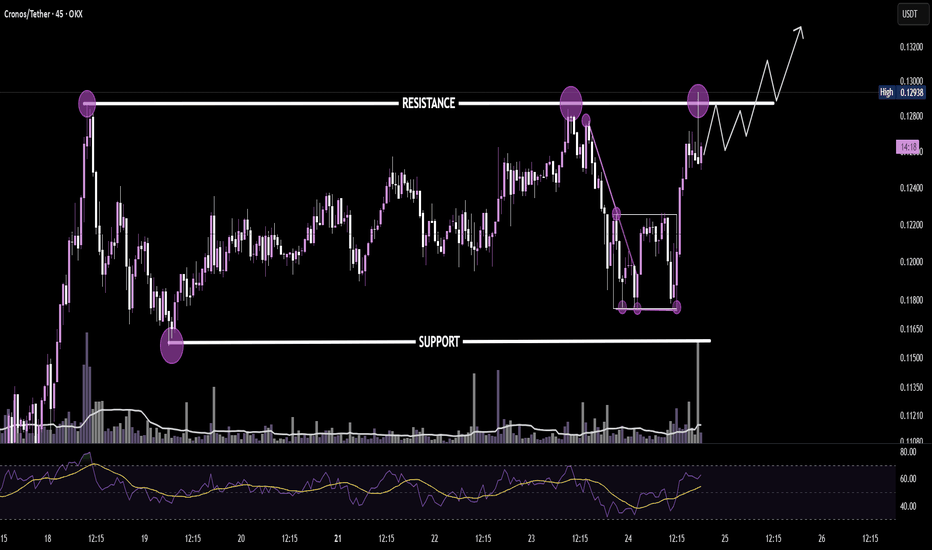
Perfect triple tap at support led to a sharp reversal. Price now testing range resistance — clean breakout structure forming. If confirmed, eyes on continuation toward $0.132+ 🚀
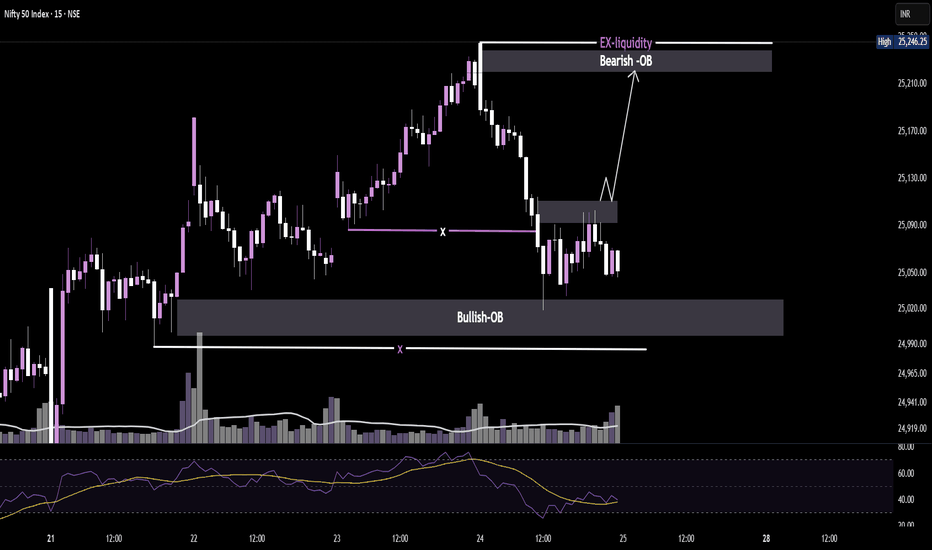
Price tapped a bullish order block, reclaiming structure with volume backing. Now aiming for the bearish OB + external liquidity above 25,240. Clean transition zone — watching for rejection or continuation.
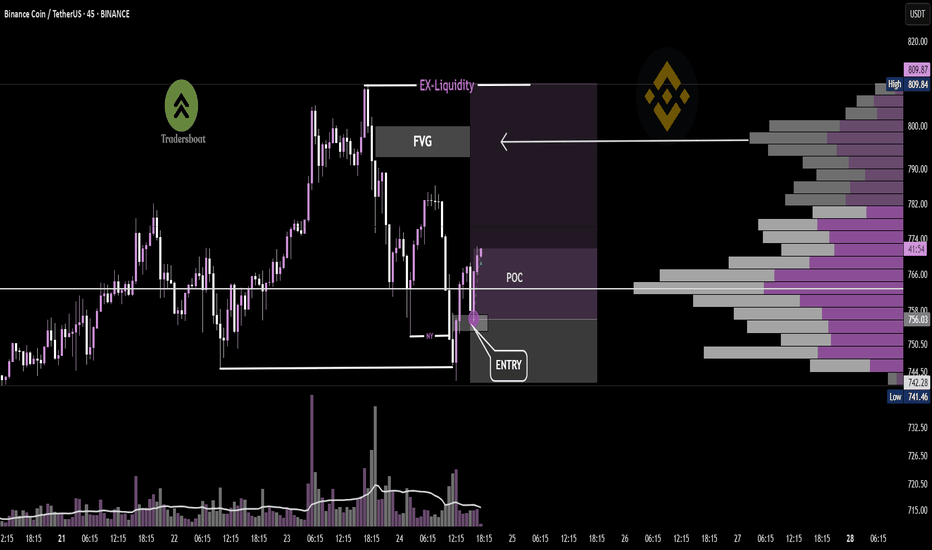
Price swept the New York session low, tapping into a key POC zone. A strong bullish engulfing candle followed, signaling potential reversal from demand. With momentum building, the setup targets the recent external liquidity above near FVG highs — a classic SMC bounce play.🔁
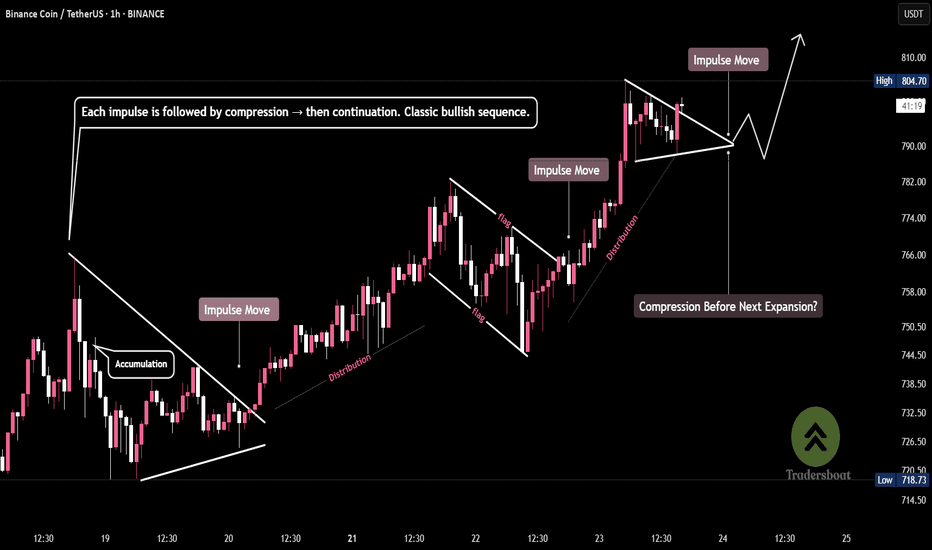
Every move tells a story: impulse, compression, expansion. Price respects structure and rewards patience. Smart money accumulates in flags, then drives the breakout. Another triangle forming... will history repeat? BNB/USDT – Price Action in Harmony
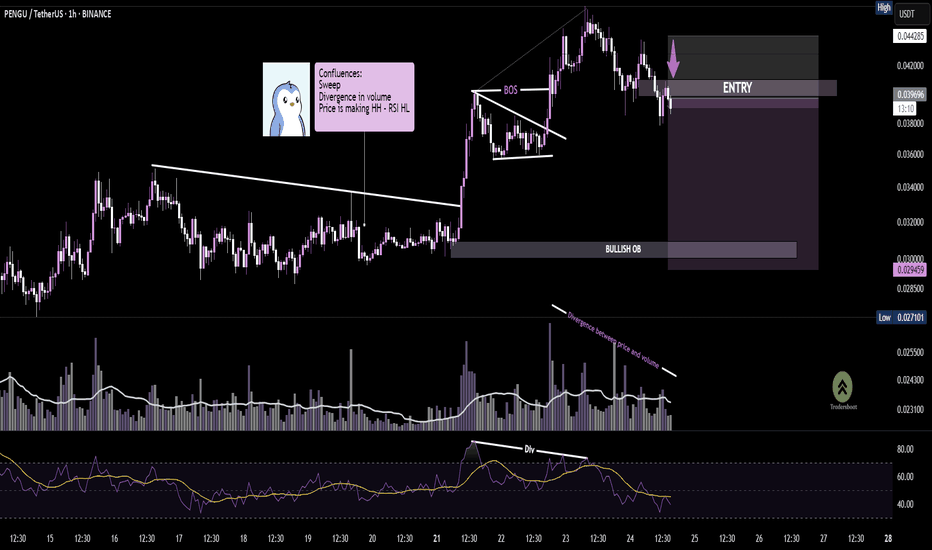
📈The setup aligns with a key bullish order block, where price is expected to revisit before a potential continuation. 📉Entry is marked just below current price, anticipating a mitigation of the FVG + OB zone. Multiple confluences (sweep, BOS, RSI & volume divergence) add conviction to this move. If validated, we could see a strong bounce from the OB zone.🧠📉
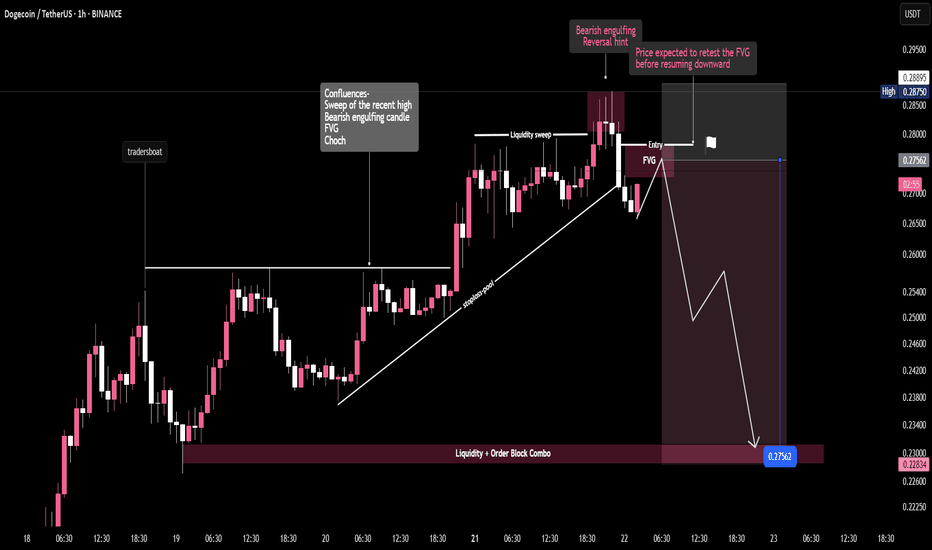
"Dogecoin Fakeout? 🚨 Liquidity sweep followed by a bearish break – Smart money eyes the FVG for re-entry. Targeting the demand zone below. Patience is profit. 💰📉"
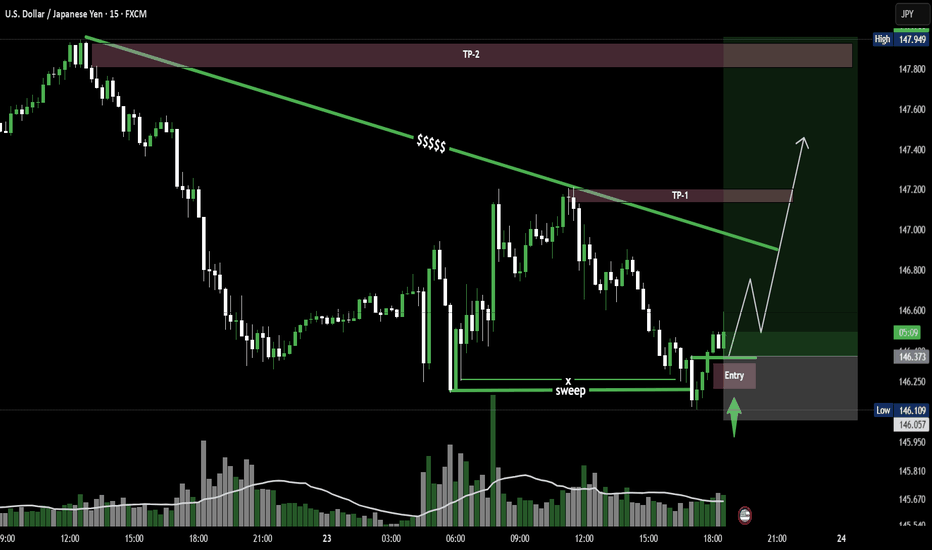
USD/JPY on the 15M chart shows a clean liquidity sweep followed by a strong reclaim and entry confirmation. Price is now pushing toward TP1 near the descending trendline and could extend to TP2, a key supply zone. Classic SMC structure in motion. USD/JPY – Sweep, Reclaim, Launch 🚀
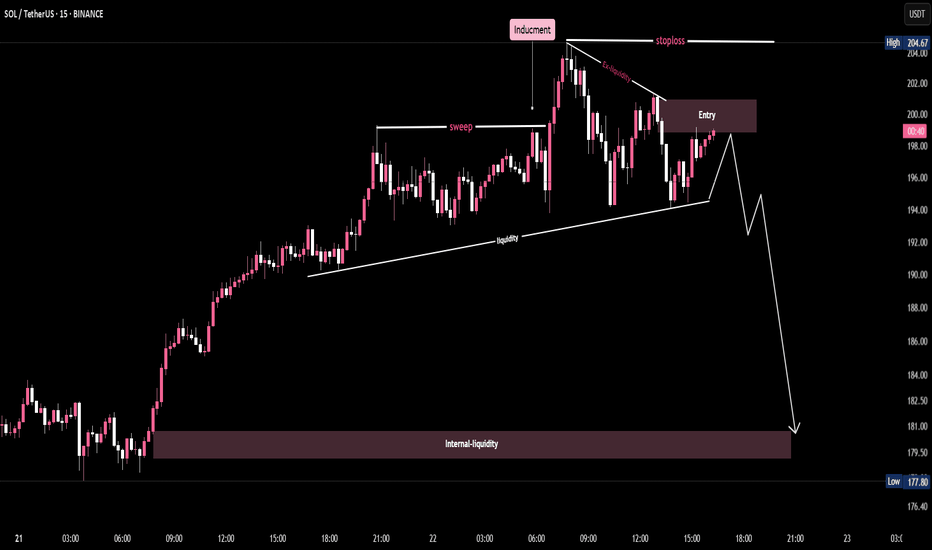
🔑 Key Points from the Chart: 1.Inducement: A price level engineered to trap breakout traders before reversing. The chart shows a false breakout above the previous high, which induces buyers. 2.Sweep: The market sweeps the prior highs (liquidity grab), enticing breakout traders. Price shortly reverses after triggering stop orders above. 3.Ex-Liquidity...
Price is approaching sell-side liquidity resting below equal lows, aligning with a key bullish order block. A potential W-pattern formation, combined with a volume spike at the sweep zone, suggests smart money accumulation. If confirmed, price may target the buy-side liquidity above, offering a high-probability reversal setup.
