tux
From my analysis, I estimate that NZDUSD will close at ~ 0.72036 @ 02-21 00:00 UTC Take profit: 0.72036 Look for entries in dips. Good luck!
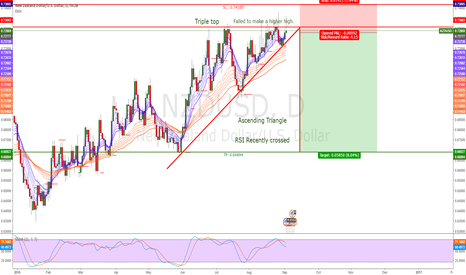
Triple top Failed to make a higher high Ascending triangle Stoch recently crossed below OB - and signal line crossed below base line SL: .74165 TP: .66894
Hey Guys, I'm seeing a Bullish Gartley pattern on NZD/USD. I'm disregarding the high of the news event, so keep that in mind... Best of luck. Remember, never risk more than 5% on a trade.
Hey everyone, this is one strategy that I have found profitable over time. It is a multiple time frame strategy that utilizes 3 time-frames. Highest time-frame is the trend, medium time-frame is the momentum and short time-frame is the entry point. Multiple Time-frame Strategy(Trend, Momentum, Entry) Script Long Term: - If closed candle is above entry then...
StochRSI is oversold on 4H Retraced and bounced off of 61.8 Fib Level Enter @ 1.30792 Stop Loss: 1.29956 Take Profit: 1.32226
D and 4H are Overbought. 1 HR Stoch RSI momentum moving downward. Entering short at: 1.11638 Take Profit: 1.10741 Stop Loss: 1.12064
4 HR Overbought 1 HR Crossed below OB Enter Short @ 0.71981 Stop Loss: 0.72429 Take Profit: 0.70871
MA's are starting to turn upwards, RSI moving upwards and hit resistance. Good luck!
Strong resistance got rejected. Best of luck, Remember, risk management is key!
NZD outlook is bearish. Liquidity is building up for another good short. Happy and safe trading!
Hey everyone, I hope trading has been good to you. I just wanted to share how I’ve been able to stay successful trading FOREX in my short trading career. The strategy is very simple, and requires only 1-2 trades per day. The way that it works is by only taking high probability trades and only looking to gain 20 pips per day. Once you prove to yourself that 20...
Using the Time Trend Indicator I see that all timeframes close price is below the SMA.
I'm fairly new to trading so please take this with a grain of salt, and feel free to leave comments on how I can improve my strategy. Based on this daily - year span chart the LONG TERM trend is going up. It does seem to be in the pattern of stepping up, down, back up, and right now its in the down pattern and if it continues it should go back up. The USD/CAD...


