tzo_trader
Essentialupdating the previous idea Diagonal down perhaps A Flat B Wave C to be executed
plotting the weekly chart using closing prices for sp500. the thrust wave requires a triangle... where would that locate?
dont even know if complex corrections are allowed to be calculated in this way
waiting to broke the green line for a sell signal. ED down, then some corrective measures that could have ended.
Update to earlier presented idea of having complex correction Z-wave can be considered as done (but does not have to be yet)
normally currencies arent good to plot on log chart but some how bitcoin seems to align to this
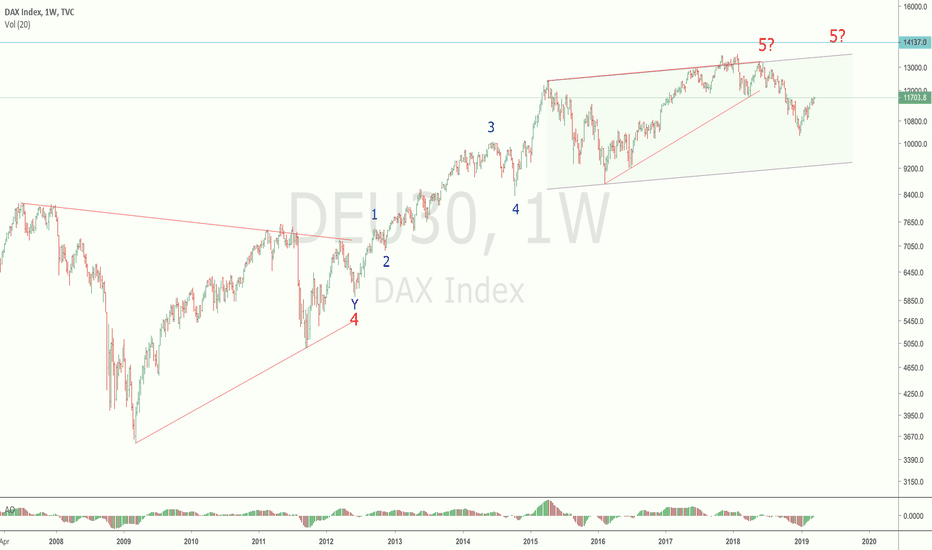
expanding diagonal case for GER30 index the AO oscillator behavior fits well to this idea - not sure how well this fits to other indexes...
DAX idea for channeling. the pattern looks more corrective than impulsive (yet). Lets wait for channel break to see how this turns out.
expanded flat probably ended and new wave down started. Expecting to see fast decline.


