vahid-72
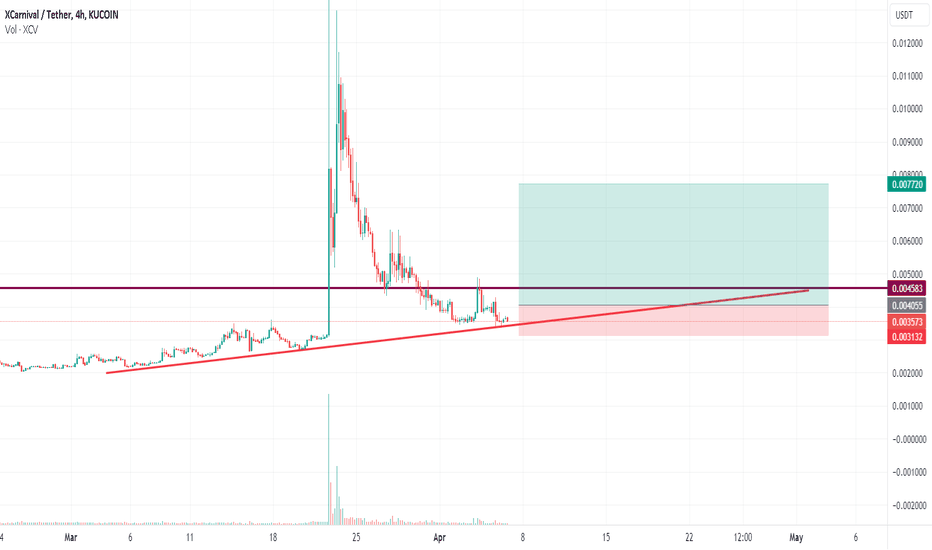
Considering the trend line and the 0.0040 area that price has met several times before. Buy at 0.0034 - 0.0036 and wait for the price to move to the bottom of the triangle. If it breaks up, it can move to 0.0080 and you gave 2x profit - stop loss 0.0031 - 0.0032
EOSC Break Triangle in 1H RSI in good condition too if good volume arrive EOSC Can move to next Resistance around 0.019-0.020
Time to Short on Luna after a good grow on last days. Look at trend line and RSI
after btc break down the trend line yesterday price decrease. but now considering the support area & RSI bitcoin have a chance to grow again. many whales bye on these prices. that's just my idea
today Near have a good grow but considering channel and rsi near is in glut condition & time to take a short on it Sell @ 19.5 TP1: 17 TP2: 15.5 This is just my idea. maybe it's true or false
hi today btc break the important line but price recovered to 41.500 now if daily candle close under this line (under 40.500) i think we see 38k then 35k & maybe 31k but if daily candle close above the line we should wait to see what is trend at the end of triangle
I think shiba Ascending trend can end soon after 5th wave. RSI in glut condition - price touch top of the channel & I think The conditions are right for a price correction to begin. That's Just My idea. maybe it will be true or false Sell: around 0.000059 - 0.000061 TP: 1: 0.00005200 - 2: 0.000044 - 3: 0.000040 SL: Daily candle close above 0.000065
That's Just My idea Dogecoin now break the triangle and ready to grow. after breaking this triangle we see price pullback to 0.26 support zone and if the price move up again, I think that's a good time for buy dogecoin. RSI in good condition too. targets are 0.37 & 0.42 Buy at 0.26 - 0.265 TP: TP1: 0.37 - TP2: 0.42 SL: Daily candle close under 0.25
Harmony One grow in last days as I mentioned in my last Analysis about One. (you can see it in my page) the target of one considering fib is about 0.45 and maybe more. but price move to top of the channel and volume decrease compare to last days. look at RSI and it's in glut condition in daily view. I think price move down from about 0.37 - 0.38 down to 0.30 and...
dydx price decreasing in last 30 days. last night price touch trend line and back of the channel & support zone move price up again. i think price move up & down again until this triangle complete (probably triangle will complete in middle of November). then price go to top of channel again and more. buy at 17.5 - 18.5 TP: 29-32$ SL: Daily candle under 15 That's...
EGLD in ascending triangle and considering news and volume maybe it broke the triangle and channel and grow to top of the channel and Resistance line & maybe more rsi is in good position too (daily) buy around 240 - 245 TP: 285 - 350 SL: 220 (daily candle under 220)
After a sharp grow today. bel in glut condition now considering volume & rsi. maybe after completing ascending flag bel start to grow again and targets considering fibo and RESISTANCE line are 4 & 4.45 buy at around 3.25 SL: daily candle under 3.10 TP: first target 4 - second target 4.45 that's just my idea. maybe it will be true or false
After grow last night. we see double top in 1h chart and maybe price back to 0.000025 sell at pullback around 0.00002880 tp: 0.00002560 that's just my idea. maybe true or false
Harmony One growing today and break the Resistance in 0.22 area. if daily candle close higher 0.23 , I think harmony one break the channel (after pullback) in next days and considering fibo 0.30 and 0.45 are possible targets to reach before end of the year. TP: first: 0.25 second: 0.30 third: 0.45 that's just my idea. maybe it will be true or false
That's Just My idea. True or False i think most of sell orders in depth view we see now are fake. whales try to push down the price to buy more at lower prices. shiba today reach in glut condition and need to pullback but now the support at 0.000021 - 0.000023 hold the price and maybe we see new ATH in next days or weeks RSI in good condition too TP: 0.000045 SL:...
in daily, we see a big double bottom pattern. and that's a good time for buy Ethereum Classic Rsi in good position too Buy @ 50-55$ TP: at least 110 - 130 SL: 40-45$ (daily)
after completing ascending flag and grow. AXS now in glut condition (RSI) and maybe double top move the price back to 105-115$ sell @ 148-152 TP: 110 SL: 157 (4h candle)
After new ATH Last Night - AXS Ready to fly again due good news and Ascending Flag pattern TP: 155 SL: 100-103


