BINANCE:XRPUSDT in its 12-hour chart reveals the completion of a corrective structure that began on June 18th when the price action bottomed at 0.2872. The rejection developed by XRP at 0.5590 on September 23rd when the price tested the dynamic resistance corresponding to the ascending channel projection carries us to expect a new decline with a potential...
NASDAQ reaches a new record high. However, Dow Jones and SP 500 still moves below the last record high.
VIX Alternatives: The chart shows two investable alternatives to trade the $VIX, these assets are $TVIX and $VXX.
AUDUSD - Looking for a New Upside During this year the Aussie eases 3.76%. Follow with us what to expect from the AUDUSD pair for the coming days in our short-term vision.
S&P 500 strikes a new all-time high More upside.
SP 500 reaches a new all-time high Comparison
SP 500 reaches a new all-time high Yearly performance
GBPUSD - Expecting for the economic data release Our outlook
GBPUSD - Expecting for the GDP data release Performance
US Dollar Index - Short-term review before FOMC Minutes Forecast
US Dollar Index - Short-term review before FOMC Minutes Summary.
XOM - Long-term wave analysis 4-hour chart.
XOM - Long-term wave analysis. Long-term overview.
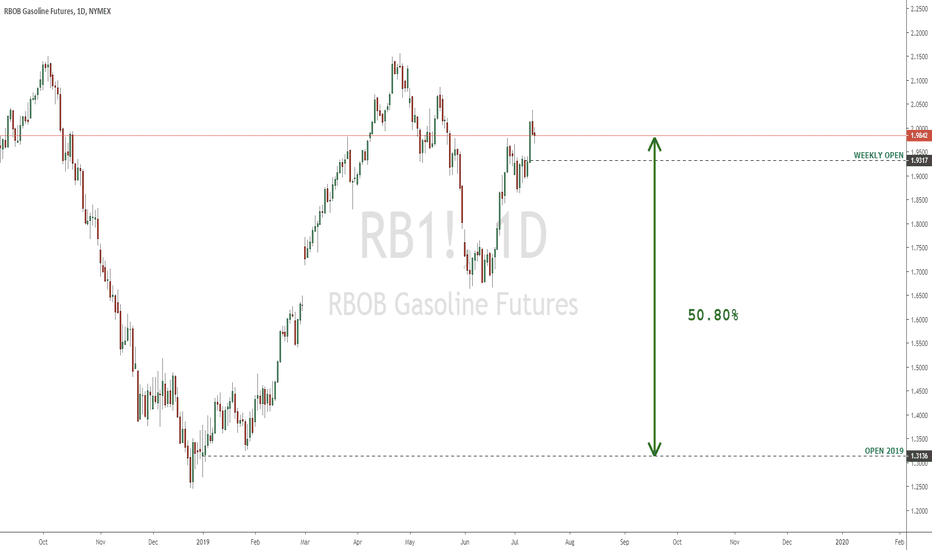
We expect the breakout on USOIL, remember the condition: Gasoline is the leading indicator from Crude Oil
Nasdaq Biotechnology Index ends the first half of the year climbing over 14% Weekly chart
General Motors - Developing a triangle pattern


