EURJPY 1D BUY @125.190 SL 124.4 TP 126.5 PRICE WAS REJECTED BY A RESISTANCE, RSI DIVERGENCE, EXPECT A RETRACEMENT BETWEEN 38%-50%, WHERE THERE IS A CLEAR SUPPORT AND ALSO A TREND LINE CONVERGING. FROM THERE BACK TO THE TOP.
NZDUSD 1D BUY @ 0.69620 SL 0.6720 TP 0.8500 1D WAITING FOR A PULLBACK TO WHERE THE PRICE BROKE BOTH A DESCENDING CHANNEL AS WELL AS A RESISTANCE. RSI OVERBOUGHT AND SHOWING TRIPLE DIVERGENCE
EURJPY SHS 4H SHORT @124.500 SL 125.200 TP 122.100 After braking the neck line the price goes down to the support in 124 makes a pullback to the neck line and down to the Head and shoulders goal at 122.100
EURJPY DOUBLE TOP, SHORT, ,@124.170 SL 124.80 TP 122.00 After braking the trend line starting May 6th, the price is going down and about to break the bottom line of a Double top, opening position a little far away but right after breaking a support. TP located a little below 38.2 retracement and right at double top goal.
EURGBP 1D SHORT SL0.90400 SL0.84500 The price have reached the top of a channel that has been there for more than 2 years. There is also a divergence in the RSI
EURUSD-4H-LONG-Channel-The price is moving inside an upside Parallel Channel TP-1-1.48- TP2 1.57 SL-1.26 This idea is also confirmed by the breakout of the downside channel showed below. So, same output, diferent ideas!!! :) Only diference, the SL gets a little bit lower under this view.
BITCOIN SHORT TP 8583 Retracement to 50 of Fibo, triple divergence in RSI
EURCAD 3D LONG Support TP1 1.52 TP2 1.56 SL 1.47 The price it's among a Support that has worked many times in the past.
EURUSD 1D Long Channel TP 1.157 SL 1.26, the price clearly broke a parallel channel and it´s now doing a pullback to the channel, good time to get LONG
NZDUSD 1D LONG Double BottomThe price already made a double bottom and its now retesting the neckline TP .6850 SL .6650
USDCHF 1D Elliott, Fibonacci, S&R LONG The way i see the price already made wave 3, although it may go down a little bit more before rising to make wave 4 around TP 0.954 My previous analysis was completely wrong
NZDUSD 1D Elliott, Fibonacci, S&R SHORT After reaching wave 1 the price moves down to create wave 2 around TP 0.715 My previous analysis
USDJPY 1D Elliot, Paralell Channel, S$R SHORT, The price keeps moving down to the bottom of the channel and still has a bit to go before reaching waves 4, c and (e) around TP 107.00 Previous
EURUSD Elliot. S&R, Fibonacci SHORT Huge correction on my previous analysis, after a very bullish movement, i had to reconsider my previous approach, i'm thinking wave (iii) is already finished and wave (iv) is in it's way down to around TP 1.22 In case you wonder
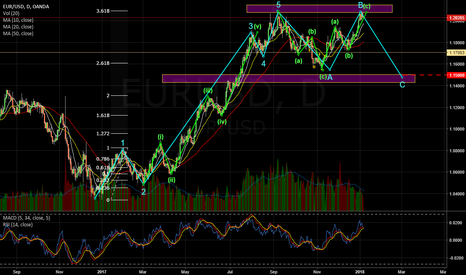
EURUSD 1D Elliot, S&R 1D SHORT As i see the price just made wave B and its in the way down to reach wave C of this flat around TP 1.1500 Big change towards the way i saw this before
USDJPY 4H Elliott S&R SHORT after reaching wave b the price moves down to create c around TP1 109.00 this considering wave a and wave c have the same size, and also because i have some doubts about my wave 4, i see it as a triangle but not quite sure weather if my count is valid, in case it is i would say the market will continue it's way down to around TP2 106.90...
AUDUSD 4H Elliot, Fibo, Trend Lines LONG after creating wave (ii) the price moves up to around TP1 0.7750 to form wave (iii) and later up to TP2 0.7820 to create both waves (v) and 1 Below a 12H view to understand how i see the whole movement A previous analysis that went good.
NZDUSD 4H Elliott Trend lines, Fibonacci LONG After finishing wave (v) and C (Confirmed wave (v) with divergence between wave (iii)-(v) and MACD) i expect the price to move up to create wave (iii) around TP 1 0.71 and for Wave 1 and (v) around TP 0.7180 A 2D view to get the whole movement idea And below my previous analysis which wasnt too bad :)


