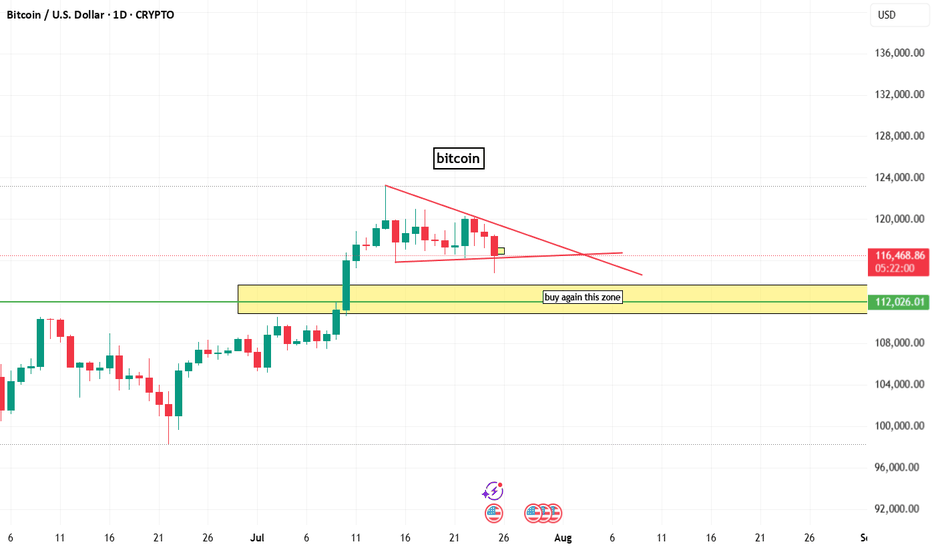
bitcoin chart analysis on daily time frame here a buy zone that indicated by box and line. and on chart bitcoin bullish but lower time frame btc is berrish.
OMAXAUTO stock chart analysis in chart gave levels and when sl trigger then please don't hold and exit.
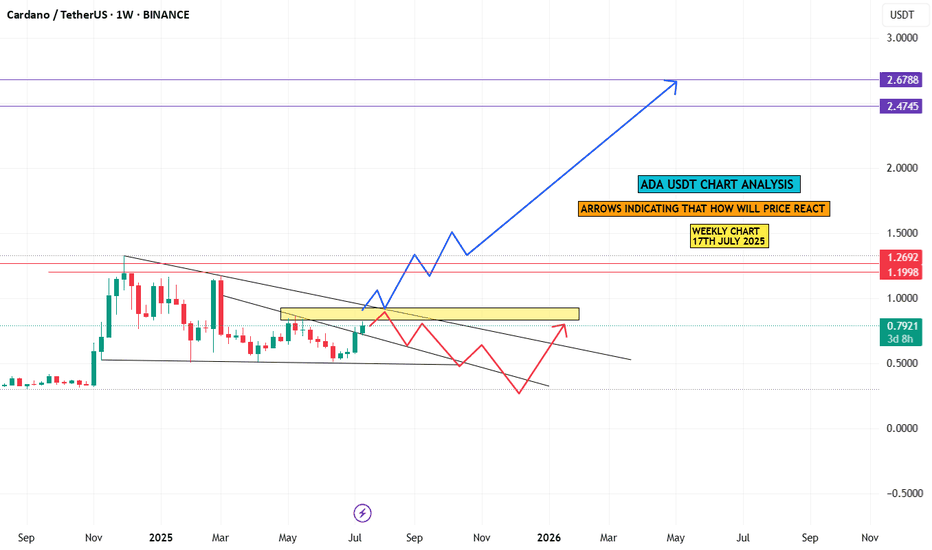
cardano weekly chart analysis n arrows indicating that how will price react in upcoming days or months,
dosto banknifty ka chart apko share kar raha hu jo apko kal ke liye help karega trading main. aaj banknifty aur nifty dono ne hee ek breakout diaya.
Here I give you a chart analysis on Nifty 50 for 8th July 2025. intraday trend is neutral and mid trend is Berish but price to shifted to bullish trend. let's see what will happen in upcoming days.
Here I m sharing of Nifty 50 index chart for 3rd July 2025, in chart you can see many boxes that are indicating of Support and Resistance. if break then you trade buy or sell. you can understand ....
today we got 3 trade and showing you through chart. how to took? booked profit on support.
NIFTY 50 INDEX CHART ANALYSIS FOR INTRADAY. here we are seeing of nifty 50 index chart, and one is resistance and one box is support that is yellow color and if price will come to support and then we will try to find of buy opportunity. if support zone breaks then we will plan for sell of nifty and if break of resistance, then we will see big rally.
Here I found that Icici Bank Chart very good and ready to move towards 900++++
BITCOIN CASH IS RESPECT OF IMPORTANT SUPPORT AND PULL BACK... BUT WE WILL HAVE TO MORE CAREFUL THAT IF SUPPORT BREAK THEN BCH PRICE MAY GO DOWN TOWARDS 250/200$
DLF CANDLE PATTERN ANALYSIS AND GAVE IDEA THAT HOW TO TRADE ON DLF?
BITCOIN PRICE IS GOOD ON CHART AND INVERTED HEAD & SHOULDER PATTERN BREAKOUT, AND PRICE SUSTAINABLE ABOVE THE BREAKOUT.
ETHRIUM BULLISH AND IN RANGE BUT WHEN BREAKOUT (THAT IS POSSIBLE 95% ) IT MAY JUMP UPTO 20%
NEOUSDT CUP& HANDLE FORMATION ON CHART
NEOUSDT CUP & HANDLE FORMATION price is looking for good to buy but please follow as chart analysis.


