vikkigenx
Trend Line break and created a lower high. Sell IOC between 73-73 for target of at least 67. Stoploss will be above 76.
Adani Ports is trading near the low of its trading range entered in 2019. Buy near 675 with a Target of 825 and Stoploss below 638
Buy Reliance @2420 with a Stoploss below 2360 for a target of 2600, 2700 & 2800. Testing Sep-2020 high. Made an Exhaustion move. Downside to the strategy: Price below 200 DMA
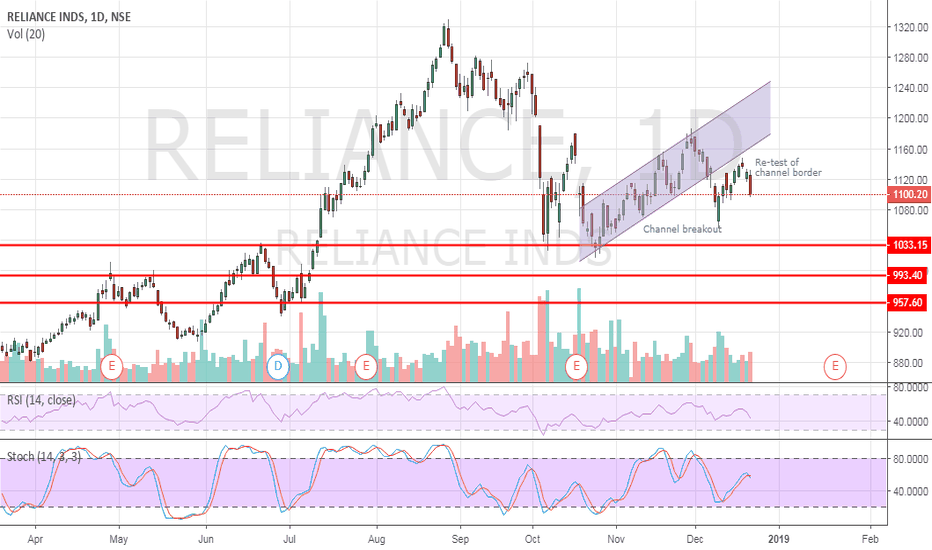
Reliance has broken an upward channel in its downtrend which started at 1300-level. The stock has also tested the lower band of the channel and fallen. This shows weakness in the stock. However, it has major support at 1033, 993 & 957 levels. RSI & Stochastic are in mid-range. Sell Reliance with a S/L of 1160.
Bank Nifty may test 26,800-26,830 region, 71.8% of last down move in a wedge pattern, A breakout from the pattern will give indication for future move. The range is also near the target of breakout of double-bottom formation (26,770).
After rising for much of 2018, crude oil is reflecting softness amid global trade wars and economic slowdown worries. On the weekly chart, crude has breakdown of a triangle pattern and gives a target of $55 on percentage-basis. The target is expected to be reached in the next 7 months.
TCS made a Head and Shoulder pattern on its daily chart. It made the top with a close at ₹ 2567.50. The neckline came at ₹ 2405.10. TCS broke the neckline today with a long red candle and closed 2.7% down. Also the Chaikin Money Flow indicator is in negative territory near its lower range. This suggest a selling pressure on the stock.
RSI started forming divergence since April. Gold taking support at 1200 and bounced back. Now as it broke that support, it will act as a resistance and may test it again. Next major support is at around 1050. So, Sell Gold at around 1195, while it goes back to test 1200 for a target of 1050. Close position if it moves back above 1200 and sustains.
Long gold at current price (1218) with a stoploss below 1200, which is Triangle base and mid-term support ( Gold has bounced back twice at this level. Also there are two price & RSI divergences as shown on the chat by blue and red line. Also lower low made yesterday is within Bollinger Band's lower band while the earlier low was outside it. It signals a turn back.
Buy now @ 1289 with a stoploss of 1284.80 (below 1285) for a target of 1310. Hoping for a test of previous low and bounce back to earlier high.


