vs_sayin
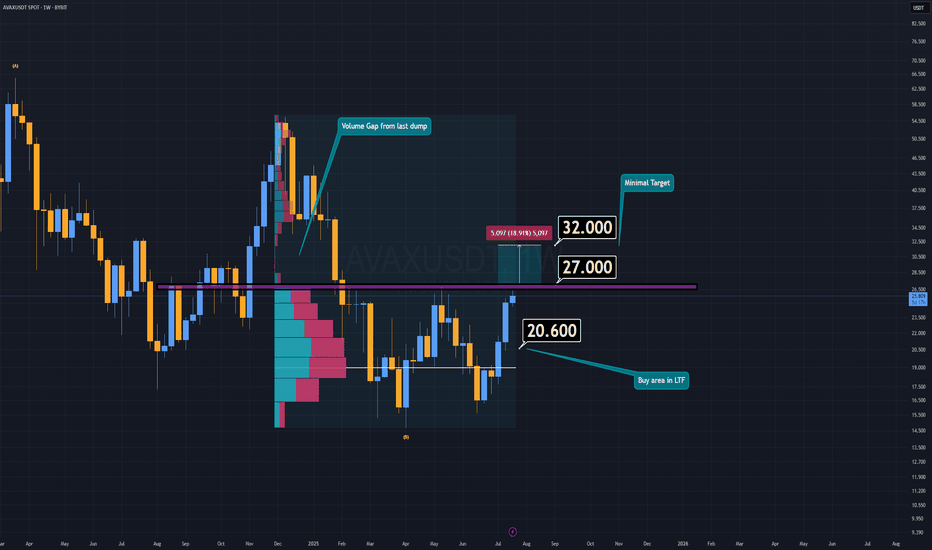
PremiumAVAX is currently attempting to form a double bottom pattern, which could signal a strong bullish reversal if confirmed. Earlier this week, AVAX made an effort to break down the key support/resistance zone, but it lacked the necessary volume to succeed. If AVAX manages to reclaim the resistance area around $27 or higher, and confirms the breakout with a daily...
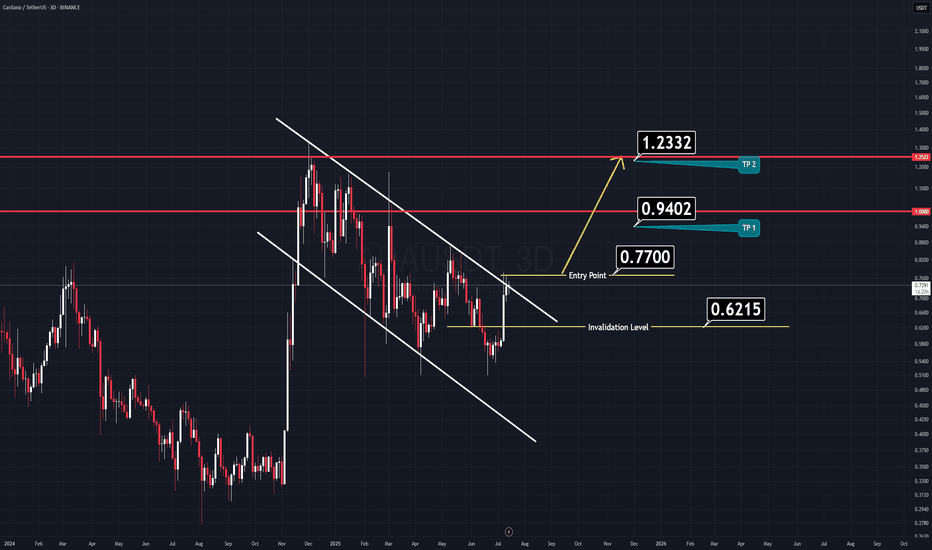
Here’s another clean and straightforward chart, this time on Cardano (ADA). ADA has formed a large flag pattern, which looks poised for a breakout soon. Just like the previous setup, nothing complicated here. ✅ Entry Idea: Consider entering when the price breaks above the previous daily candle’s high. All the key levels are already marked on the chart for easy...
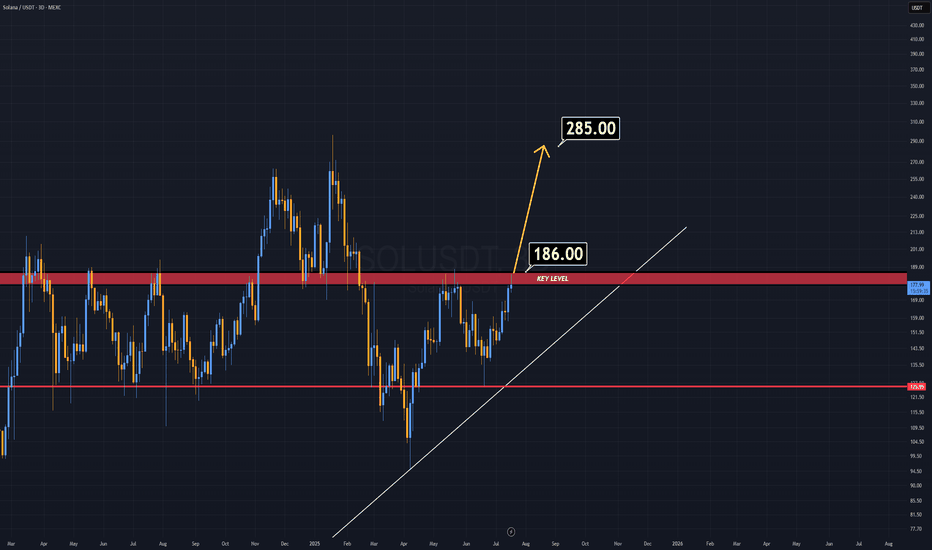
There is no need to explain why if you are in this market for a while. A weekly candle close above $186 will ignite a rally on SOL. The important key word in here is "weekly" , not "daily" . Good Luck.
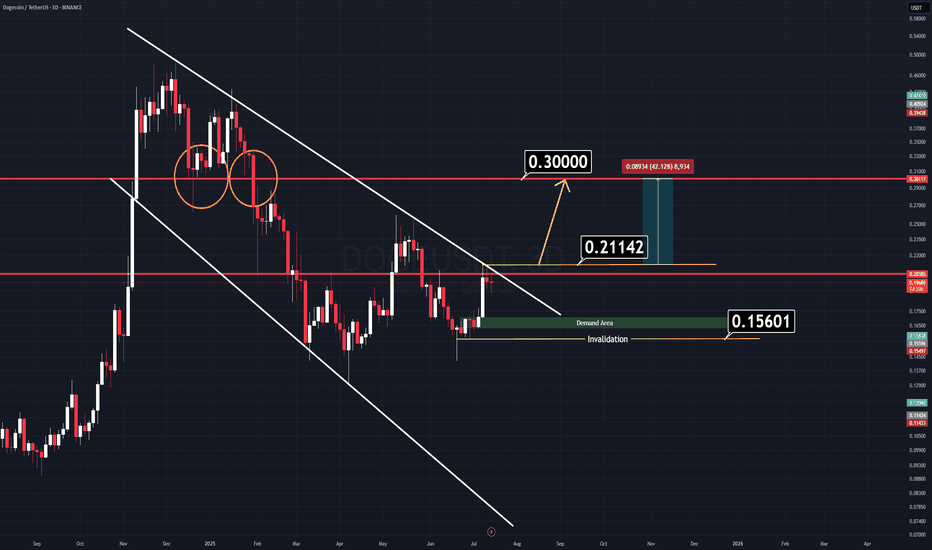
There’s a very simple and clear chart setup on Dogecoin (DOGE) right now. We have two major horizontal key levels and a channel that is about to break down. If the price manages to close above the yellow-marked line ($0.21142), we can expect a strong rally to follow. There’s no need for complicated indicators cluttering the screen — all relevant levels are...
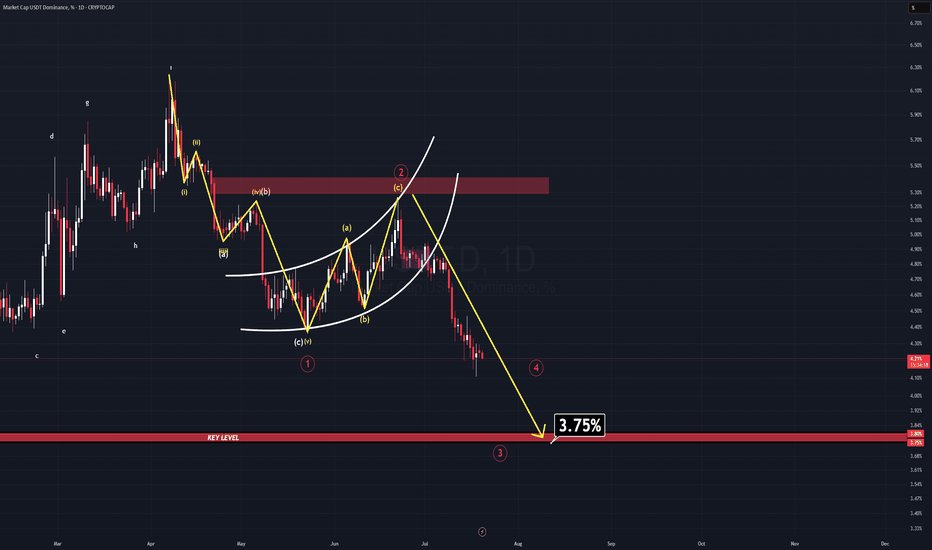
In a previous analysis, I mentioned that the long-term outlook for this parameter (USDT.D) remains extremely bearish. At the time, a bear flag was clearly visible—but it hadn’t been broken yet. Well, now it has. The breakdown confirms the bearish continuation, and there’s still more room to fall. As USDT.D continues to descend towards the projected target for...
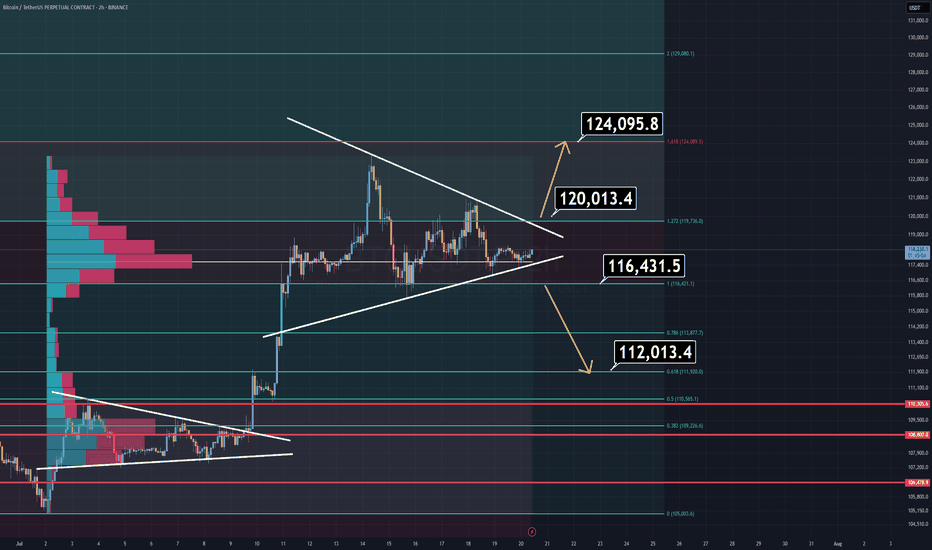
Bitcoin is currently consolidating within a symmetrical triangle, suggesting indecision in the market. However, a breakout is imminent — and when it comes, it will likely be sharp. 🔹 Bullish Scenario: A breakout above $120K would likely lead to a new All-Time High near $124K. 🔹 Bearish Scenario: A breakdown below $116,400 opens the door for a quick drop toward...
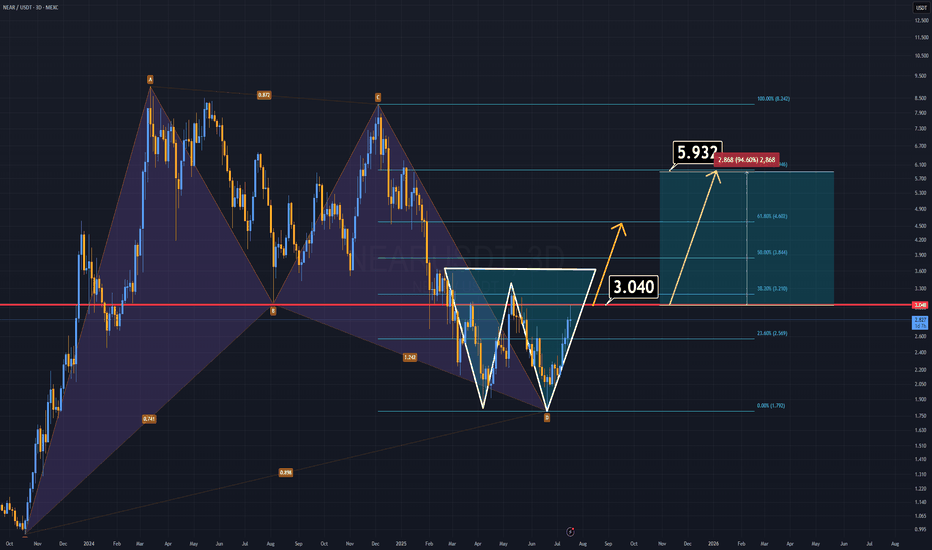
NEAR Protocol has formed two strong bullish patterns and looks ready to climb, especially with the highly anticipated altseason on the horizon. 🔹 A harmonic structure from the previous cycle remains intact. 🔹 A double bottom formation is now clearly developing. If NEAR manages to close a daily candle above the $3 level, we could see the price double in the short...
The TOTAL2 chart — representing the altcoin market cap excluding Bitcoin — currently shows signs of weakness. A double top formation has emerged and is actively playing out. In addition, a micro trend change of character has clearly appeared, further validating short-term bearish pressure. Technical Observations: Price recently retested a broken support level...
The USDT Dominance (USDT.D) chart — often referred to as the “reverse chart of crypto” — is currently showing signs of strength. On the micro time frame, a new impulsive wave structure has emerged, and we are likely progressing through wave 3 of this formation. Wave 3 appears to be targeting the 4.88% level. A minor correction (wave 4) may follow. Ultimately,...
After counting many waves for many days, I have a senario for USDT dominance which will lead the entire market on its way. For those whose not fimiliar with this parameter, there is a very simple explanation. It's the reversed way to see the market. If this parameter drops, your alts will skyrocket and if it rises, you're gonna be crying on somebody's X post's...
Solana has recently completed its 5-wave impulsive rise, and now a correction phase appears to be underway. Notably, a diamond top formation has formed and already broken to the downside, further supporting the short-term bearish outlook. As long as SOL trades below the $180 resistance, this corrective scenario remains valid. I currently do not expect a drop...
Chainlink (LINK) Technical Outlook – Elliott Wave Perspective After applying Elliott Wave Theory, the chart appears to speak for itself — the downward corrective phase seems to have concluded. Zooming into lower timeframes, there are several bullish signs suggesting that LINK is primed for an upward move. Key Technical Reasons Supporting Upside...
Red candles may be approaching for the TOTAL market cap parameter. Currently, TOTAL is sitting right on a strong support zone that has held multiple times in the past. However, if this level fails to hold, the market could experience a sharp decline in the coming days. Two Possible Scenarios: Bullish case: If the market manages a bounce this week, there’s a...
In my previous analysis, I presented two different perspectives on LINK. On lower timeframes, LINK completed its 5-wave impulsive structure, but in doing so, it invalidated the macro reversed Head and Shoulders pattern—rendering it no longer valid. Currently, LINK has entered a classic A-B-C corrective phase, signaling temporary market weakness. If the price...
S is Preparing for a Key Liquidity Grab and Potential Reversal Previously, S swept the liquidity from the upside and formed a zig-zag corrective structure within a descending channel. Following a clean breakdown, it has struggled to recover — despite broader bullish conditions in the market. Now, the structure is showing strong signs of a potential long-side...
CRV has formed a Cup & Handle pattern — a well-known structure that typically signals a bullish reversal. From a broader technical perspective, there's additional confluence suggesting a potential trend shift. If the most recent dip holds, it may confirm that CRV has completed its bearish cycle and has now entered a new five-wave bullish structure. Based on the...
Bitcoin Cash (BCH) is currently showing multiple technical signals that support a potential bullish continuation. A reversed Head and Shoulders pattern is in the process of forming, and it aligns well with several key confluences — including the Ichimoku Cloud and volume profile support zones. A breakout above the $430 level would not only confirm the pattern...
There’s a common misconception when it comes to the relationship between the U.S. Dollar Index (DXY) and Bitcoin — and it's time to take a deeper look. While the short-term movements of DXY can create temporary pressure on Bitcoin, the broader correlation tells a different story. If you zoom out and analyze the larger structure, an interesting pattern begins to...
