USD/CHF Daily: Price > 200EMA Swing Period 10 Swing Low: 1.10884 Swing Low: 1.15030 Volume Imbalance: 3 Candles Daily Order Block: 1.12253 / 1.11294 H4: Price > 200EMA Swing Period: 7 Swing High: 1.15030 Swing Low: 1.12860 Volume Imbalance: 2 Candles H4 Order Block: 1.13452 / 1.13089 H1: Swing Period: 5 Swing High: 1.15030 Swing Low: 1.12860 Volume...
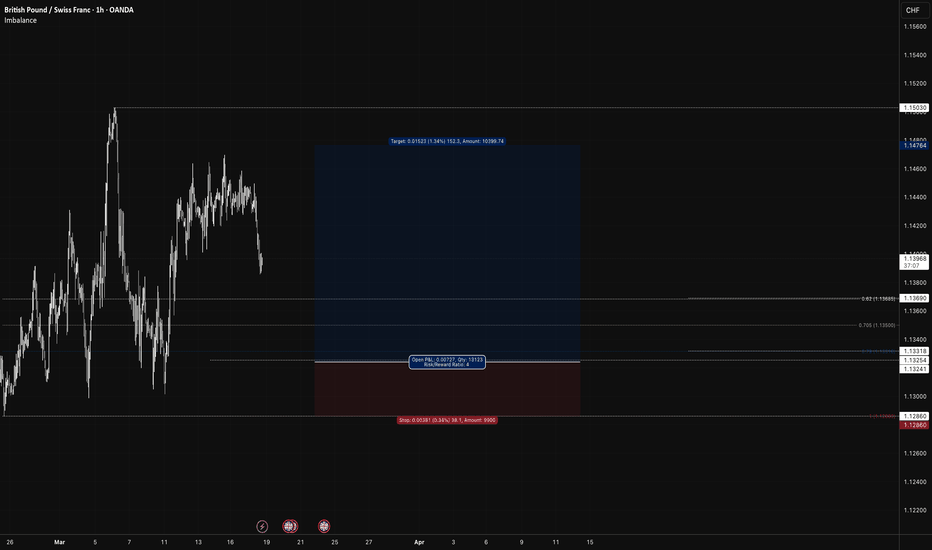
Summary of my analysis o GBP/CHF - I trust you will provide me with some feedback this will encourage me to share my thought process to the wider community. I am not a signal provider just sharing knowledge and ideas using theories I have learnt over the years. Daily: Bullish Daily Price above 200EMA and 50EMA > Bullish Bias The last valid swing low was...
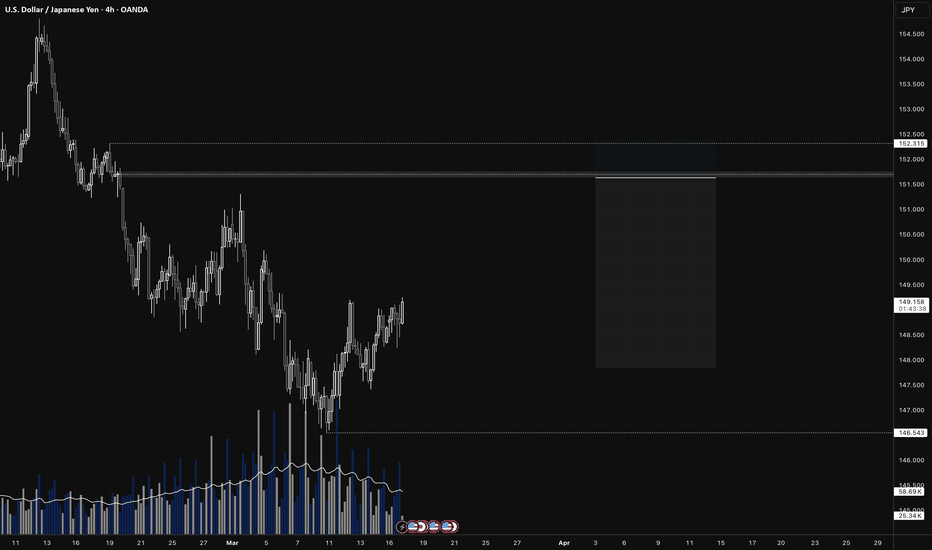
Weekly (Bias Validation) - Price between EMAs → ❌ Ranging - Major Swing Point High: 158.880 Low: 146.543 D1 (Daily): Trend Bias - Price below 200EMA & 50EMA on D1 → ✅ Bearish Bias - Major Swing Point High: 154.804 Low: 146.543 - ✅ Break of Structure (BoS) + Volume Imbalance - Price below Weekly VWAP → ✅ Bearish Bias H4 (4-Hour): Trend Bias - Price below...
Daily: Price < 200EMA Swing Period 10 Swing High: 158.880 Swing Low: 146.543 Volume Imbalance: 5 Candles Daily Order Block: 155.223 / 153.916 H4: Price < 200EMA Swing Period: 7 Swing High: 152.315 Swing Low: 146.597 Volume Imbalance: 3 Candles H4 Order Block: 152.762 / 151.242 H1: Swing Period: 5 Swing High: 152.315 Swing Low: 146.597 Volume...
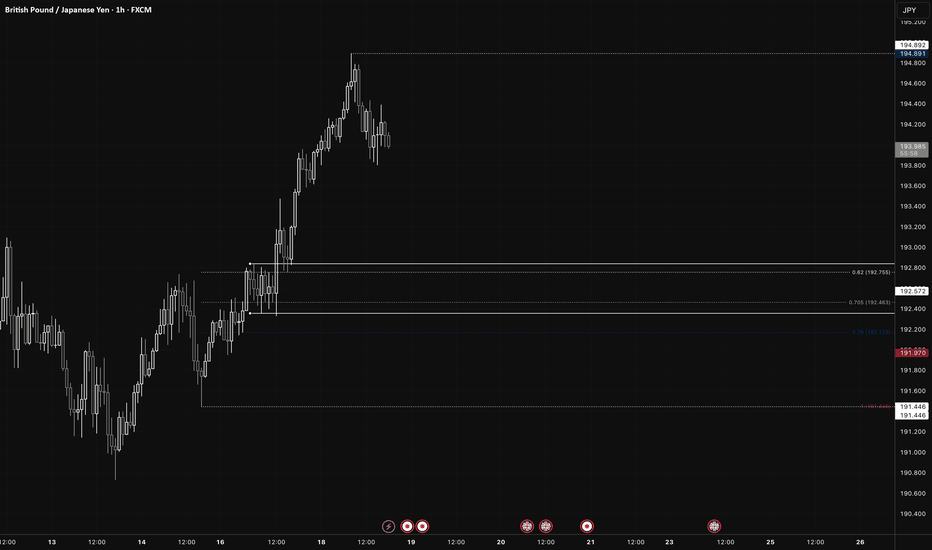
Daily: Price > 200EMA Swing Period 10 Swing Low: 187.666 Swing Low: 194.892 Volume Imbalance: 2 Candles Daily Order Block: 197.399 / 195.104 H4: Price < 200EMA Swing Period: 7 Swing High: 194.892 Swing Low: 190.728 Volume Imbalance: 2 Candles H4 Order Block: 192.357 / 192.841 H1: Swing Period: 5 Swing High: 194.892 Swing Low: 191.446 Volume Imbalance: 11...
Strategy Summary: This strategy is designed for the M1 and M5 timeframes and has been personally tested, demonstrating strong results. It is a mechanical system with strict rules to ensure discipline and consistency in trading decisions. Whilst I have personally used this system on XAU/USD it can be applied to other volatile asset classes. Indicators Used:...
I’ve been trading for five years now, and it’s been a wild ride! There have been ups and downs, but I’ve finally started to get the hang of the basics that make trading successful. It’s been a lot of hard work - studying, trying things out, and learning from my mistakes. But it’s made me a more focused and disciplined trader. Now, I’m excited to share my ideas and...
This is my analysis on AUD/CAD for educational purposes documenting my thought process with the hope of attaining some feedback on my analysis. Please note the is a counter trend idea targeting the daily swing structure. Higher Time Frame Weekly - Structure on the weekly chart is bearish. Daily - Structure on the daily chart is bearish. Medium...
USD/JPY (H4) Long Monthly: Strong supporting bias January open is higher than December close . Weekly: This weeks Open/Close suggests price may pull back before continuing upwards. Daily: Price is above the 200. H4: Swing Low: 17th December @ 13:00 (A) Swing High: 30th December @ 01:00 (B) Entry Price: 155.616 Stop Loss: 153.161 ...
USD/JPY - Strong bullish movement on HTF with volume imbalance - Swing High/Low identified on H1 timeframe - Possible Pullback and continuation to the weekly swing high - Imbalance on H1 and BoS strongly supports a bullish move around 38.2 / 50 Fibonacci - Generous SL of 70pips targeting 1:1.5 for the first target and 1:2 for the 161.8 level
Testing a strategy so based on recent findings expecting a strong push down before we move up towards tested highs on Gold. Looking for entries in the grey area (key daily zones)
Triangle pattern on the 60 minute chart and approach towards the possible support area of 1.3362 breakout occurred at 1.33865
Possible short on this exotic pair with reasoning highlighted on the chart.


