wasif87
PSX:PRL 1. Weekly chart suggests that price is working in cup shape. 2. AB:CD pattern is in play since 2023. 3. DEC23 : 35, Dec24: 45 4. Safe bet for PRL with current patterns is 55-60
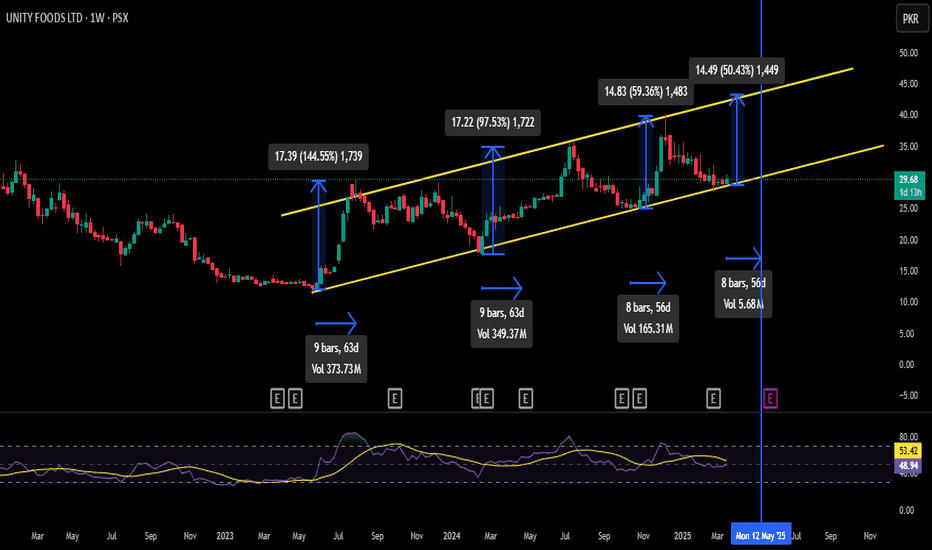
PSX:UNITY Weekly upward channel suggests that; 1. when it hits channel bottom and forms a bullish candle, 2. it needs 8-9 weeks for upside move and hits channel top, 3. this time, it is coming around 42+ or 48% gain from CMP.
FX:GBPUSD GPB long @ breakout of 1.26935 (consolidation box) with TP of 1.283235. Risk of 0.5%
TADAWUL:TASI Harmonics pattern drawn on TADAWUL:TASI shows the bullish trend till 11100-11200. Bearish reversal zone may start from this zone and may correct around 10960-10860. After taking correction, #tadawul will continue its move towards 11625 as showing strong bullish trend.
NASDAQ:TSLA ABCD Harmonic Pattern on NASDAQ:TSLA suggests that; Buy on dip strategy is recommended HH & HL is observed on daily timeframe Gap will be filled around 258-263 If it sustains, supply will be observed around 300-315
FX:GBPUSD Cup & handle pattern shows that GBPUSD will hit around 1.29800 mark in coming months; an upside of roughly 3.8%. Happy Trading !!
NSE:BANKNIFTY Supply & Demand Zones have been highlighted on daily timeframe for understanding trade setups. Change of character in index has been observed after 41300, when it has not marked any LL. After continuing its strong upward move; previous supply zones start around 43000, 43500 and ultimately around 44000 (latest high of 14-Dec-2022). While price...
NYMEX:CL1! Crude oil is moving upwards by marking HH @ 95 and HL @ 81.5, 81.5 is .786 fib support from previous low), Curved parallel channel suggests that max downward should be around 79; which is .886 fib level from 77.71), 97 & 104 will be crucial level in coming weeks as resistance.
OANDA:XAUUSD RR : Almost 3 for the final TP SL : 1794, Entry @ CMP TP: 1871, 1890, 1910, 1945
TVC:DXY Fibonacci plotted on DXY index suggests that it is consolidating its support on 101 since 01.Feb.2023. 101 is a serious support it tested in Jun2022 and we saw a bullish rally after that. Very next resistance level will be 105 !!
BINANCE:BTCUSD KEEPING IT SIMPLE CASE A : RR @ 1.66; Entry around 27k, Exit around 31.8k CASE B : RR @ 1.97; Entry Around 27k, Exit around 36.2k CASE C : RR @ 1.55; Entry Around 27k, Exit around 40k (stop loss put much lower in case liquidity is driven around 19k, which is very much less expected scenario)
NASDAQ:NVDA Looking at the past is easy, but learning from it is easier. Let's get listed the points. 1. Breakout of trendline on 24Jan23, that started on 19Nov21, confirmed on 29Mar22; 2. Bullish divergence started in Sep22 and confirmed in mid Oct22; 3. No lower low after 13Oct22; 4. Breakout of previous lower high of 13Dec22 on 24Jan23...
BINANCE:NEARUSDT Near possible retracement towards 4.7, from where we can see possible reversal towards 7.96
NASDAQ:MSFT Harmonics pattern drawn on NASDAQ:MSFT daily timeframe chart suggests that bullish trend may continue till 305, before it starts some correction for next move.
INDEX:BTCUSD Chart patterns identified on INDEX:BTCUSD for long term timeframe.
INDEX:BTCUSD Weekly Fibonacci levels on BTC identified for key retracement levels.
TVC:GOLD 15min timeframe on TVC:GOLD showing bullish pattern buy @ 1918.75 sl @ 1909 tp1 @ 1925; RR @ 0.7 tp2 @ 1930; RR @ 1.29 tp3 @ 1937; RR @ 2.1
NASDAQ:TSLA Fibonacci Retracement on NASDAQ:TSLA implies that it may take support on fib level of 0.236 of 176-177 dollar. Current price structure shows that it has taken resistance of 0.38 of 222 dollars, therefore, it may go down towards 146 to fill the gap. At this level, its RSI will also be oversold which will trigger bullish rally towards 177. Tesla...


