wdstrades
Price has tapped into a major support zone that’s held strong since early 2024. With confluence from the Fibonacci 0.618–0.65 retracement overhead, we could see a sharp bullish reversal targeting that region. 🟧 Strong support – historically reactive 📈 Potential bullish reversal in play 📊 Fib confluence at 152 – key reaction area ⏳ Watching for...
Description: Price is moving within a rising channel, heading toward a key liquidity zone sitting right at the golden pocket and just below equal highs . This confluence makes it a prime area for a potential fakeout and reversal. I'm watching for a liquidity grab above , followed by a sharp rejection . 🟦 Rising channel structure 🟨 Golden Pocket + ...
Price recently tapped into a key resistance zone where an imbalance was filled by a wick, showing signs of potential exhaustion. We could see a liquidity grab above before a significant move down toward the 5,150 level. Watch for a reaction in the highlighted resistance area – this could be the beginning of a bearish reversal. Major support sits lower, where a...
The US 100 index shows intriguing price action as it navigates key technical levels. Currently trading at 18,967.2 , the market has formed a clear double top pattern at the resistance zone, suggesting potential exhaustion in the uptrend. Key Technical Observations: The chart reveals strong resistance near recent highs around 19,024.3 , with price...
GBP/JPY 1H Technical Analysis - Key Levels Price action shows clear resistance zones marked by Lift indicators at 0.28 , 0.08 , and 0.06 levels. The market appears slightly overbought with Lift readings of 0.01 to 0.05 , suggesting potential for pullback or consolidation. Key observations: - Resistance cluster between 0.06-0.28 may cap upside moves -...
The 1-hour chart reveals BTCUSDT navigating crucial price territory, with immediate focus on the 85,000.0 to 88,000.0 range. The market shows subtle but important movements, with current price action hovering near 84,260.1 after testing higher levels. Key observations from the chart: The volume profile indicates weakening momentum as price...
This 1-hour chart of SOLUSDT (Solana Perpetual Contract) showcases a potential 5-wave Elliott impulse structure forming within a larger resistance zone. - After breaking down from the highlighted resistance range (roughly $122–$129), SOL is currently retracing upward in what appears to be an impulsive 5-wave correction. - Waves (1) through (4) seem to be in...
This S&P 500 E-mini Futures (ES) daily chart highlights a potential bearish Elliott Wave structure following rejection from a key resistance zone. - The market encountered strong resistance near the 5,600 level, leading to a sharp decline. - A five-wave impulsive bearish structure appears to be forming, with Waves (1) and (2) already completed. - If this...
This EUR/USD 1-hour chart showcases a classic Bull Flag Pattern , a strong continuation formation indicating the potential for further upside momentum. - The pair experienced a sharp bullish impulse move, forming the flagpole. - The price then entered a consolidation phase within a downward-sloping channel, forming the flag. - A breakout above the upper...
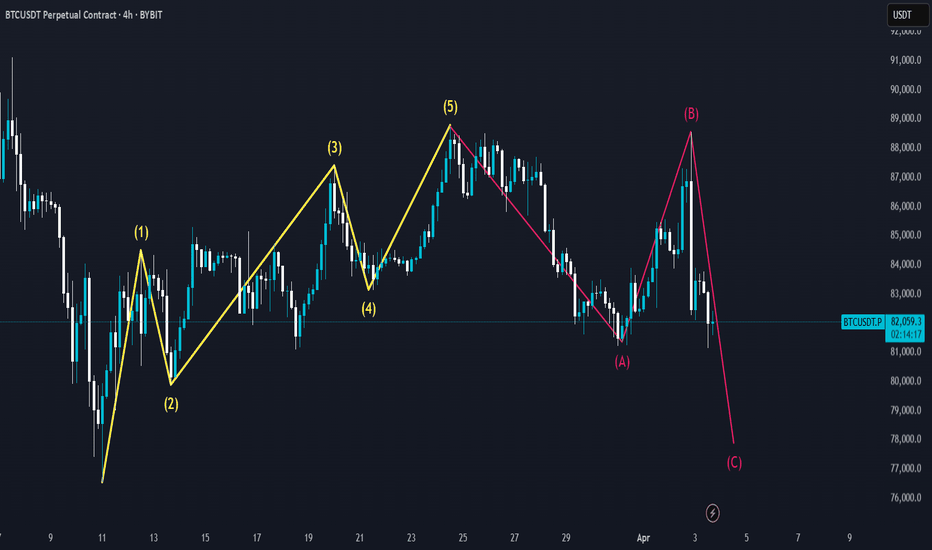
This chart illustrates an Elliott Wave pattern on BTCUSDT in the 4-hour timeframe. The market initially completed a 5-wave impulse move to the upside, labeled as (1)-(2)-(3)-(4)-(5), signaling a strong bullish trend. Following the completion of Wave (5), a corrective ABC structure has begun, indicating a potential retracement phase. - The 5-wave impulse...
Current Price Action: Gold (XAUUSD) has reached another record high at 3,175.06 on the 4-hour chart, showing strong bullish momentum. The price is currently hovering around 3,127.07 after a minor pullback from the peak. Key Levels: Resistance: The all-time high at 3,175.06 is now the key level to watch. A break above could signal continuation of the...
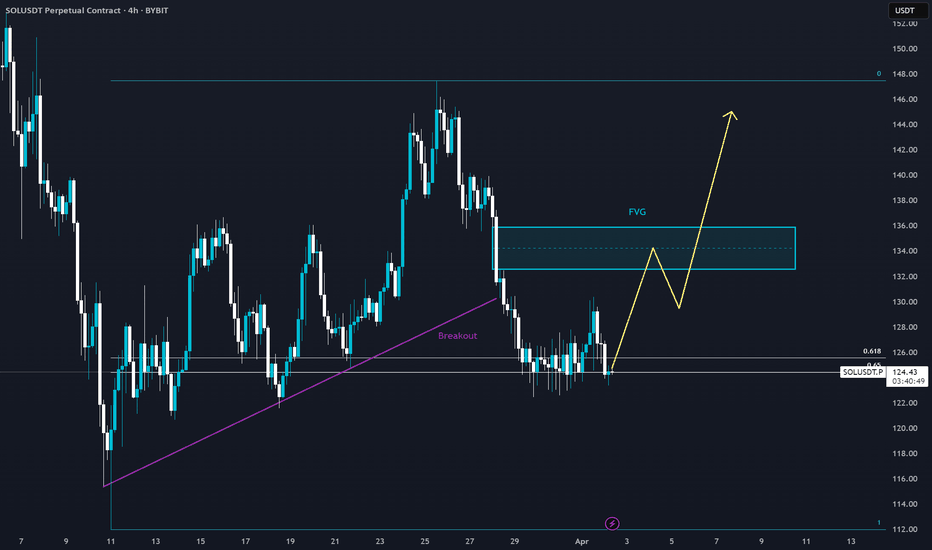
This 4-hour SOL/USDT chart shows a breakout retest at a key support level, with a potential move toward the Fair Value Gap (FVG). Key Observations: 🔹 Breakout & Retest: Price has broken below the trendline and is now stabilizing near support. 🔹 FVG Target: A bullish reaction from this level could send SOL toward the FVG before further continuation. 🔹...
This 4-hour BTC/USDT chart highlights a key resistance zone where Bitcoin is approaching a Fair Value Gap (FVG) near the 0.618-0.65 Fibonacci retracement level. Key Observations: 🔹 FVG Resistance: Price is nearing an area of unfilled liquidity, a common reversal zone. 🔹 Potential Rejection: A move into the FVG could trigger sell orders, leading to a...
This 4-hour chart of ADA/USDT shows price making a strong recovery after a significant drop. However, it is now approaching a key resistance area—a Fair Value Gap (FVG) near the 0.618-0.65 Fibonacci retracement levels. Here’s the potential setup: 🔹 FVG Resistance: Price is entering a liquidity zone where sellers might step in. 🔹 Possible Double Top...


