This is a precise analysis of the previous forecast. We expect tomorrow to climb the price to the blue limit And falling prices to the specified range
Hello friends I set the expectations of the price with the lines
Hello friends We expect the price to rise to 16108 resistance range And even the failure of this resistance range
Hello my friends As it seems, we should see a fall in the price of at least the blue range Thanks for your likes
Green level: It's a supportive price response Red surface: A resistance that can hinder the ascent of prices Orange surface: Brittle surface It is expected to fall to the red area ...
We expect a fall to range 15741 target1:1.1600 target2:1.1590 target3:111580
Ascends the price to the resistance, in a compact manner The decline to the support level after hitting the resistance
We are expecting a climb Resistance Levels: Weak yellow Strong red Levels of support: Poor green Strong blue
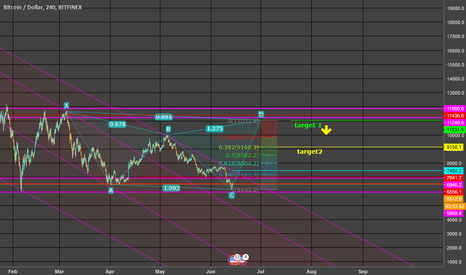
We are observing the formation of successive Hemonic patterns .... And the price movement in different channels Violet lines: Support, Strength (Strong) Red lines: overlapping Fibonacci resistance waves ___ Note: is the trend descending, never make a trades contrary to the process, It is true that this analysis, when passing through the price of 7488.2 ___ Final...


