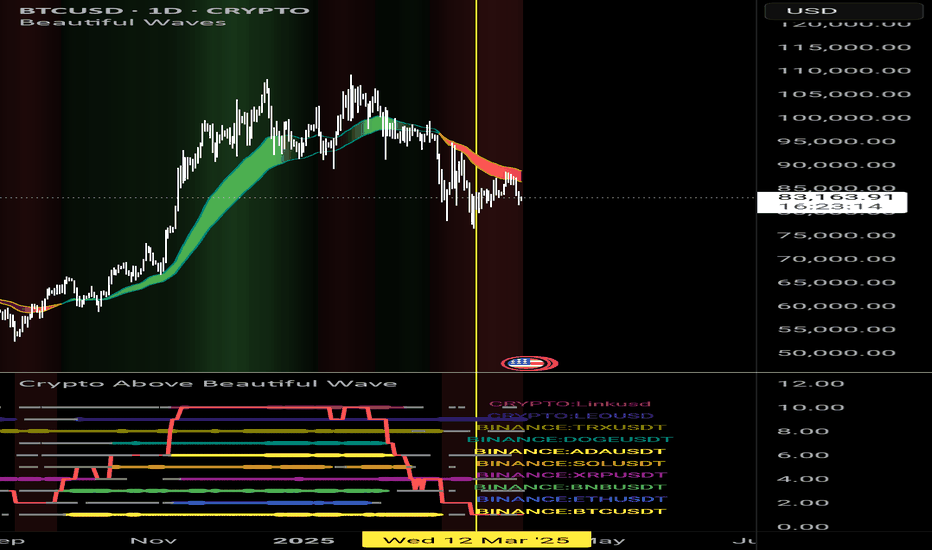
I have made market watch baded on indicator on main screen. It aggregate view on main alts. Fat dot is bullish. Thin coloured dot is signaling possible entry. Gray dot is bearish. No dot is just downtrend. Solid line is showing how market is performing. Now its valie is 1. In the recent past it was good place to enter long trades. Marked with yellow lines. Be...
Comparing to previous cycle we have mixed signals. We can count on third angle but we already broke same parabola from previous cycle and timewise we saw top in january 2025. I guess most secure way will be to exit on 80k when violate third angle. Comparing rsi we already topped and bbw shows violent future.
Looks like there's something interesting in trend lines originating from that point. Few times when price cross them there was some spectacular result. One time there was fat wick and spring. Worth keeping eye on those.
Some time ago I did prevented this idea. And looks like we gonna find out if this actually mean what i thought.
Well hard to argue this thing show oscylator kid behavior. I really do hope we gonna pierce dashed line. Otherwise we may have some serious discount on stocks.
When secondary trendline us briken it is nice to see change of structure. Last time (red lines) it failed. This time we are close to break new secondary trendline. I can se two tops to overcome (yellow horizontal). I don't like this one higher because alts can run really hard really fast. So this one feel late to the party. I will use the lower one to change a bit...
Last one was stopped. Crazy times ahead but I will make full risk position soon.
Lets draw few parallel lines. Looks like cross of green supports shows start of the party and crossing red resistances means music isn't playing anymore. Could be coincidence. Looks like green support is coming. If we pierce it could be bullish. Unfortunately this time is different because of inversion. We will see.
I will go half the risk. Looks like minor trend line was broken. Half the risk now and if nice break retest of weekly i will add one risk.
I put all the price history into this frame. This cycle does not look out of ordinary so far. Of course assuming this time will be the same is silly nevertheless it is fun to watch how each past cycle was developing day by day from halving point.
Many things looks fine. One thing is concerning. Although rr is around 6 risk still is over 60% so micro position money you can lose or wait for red rendline break and sl under prevois swing. I chose second. To be clear I do not have any respect to any altcoins. I hold only btc. Im trading chart not altocin so please do not enlight me how scam or game chanred ada...
Ell last entry on gme was after few years of coiling up. Now we hope for secondary earthquake. Higher risk and lower reward but let's ape in. Half the regular risk i normally play also due tu possible gaps.
Lets give it a little bit of room and buy. Looks like logical play and some key areas emerge in this structure.
Possible buy ahead but this support is getting weaker.
Not sayng today but on weekly piercing this ribbon from below and stayng on top means good times.
Well not so much to say. Nailed the top and secondary trendlinie nailed the bottom. Now primary downtrend was broken.
Here's two channels. Simple idea. Many touches. Depth is spiraling out of control. Printing doesn't stop. Economy will not take anymore suppression. QT need to stop. This looks like nice place to resume fiat weakening.


