xiannvyou0
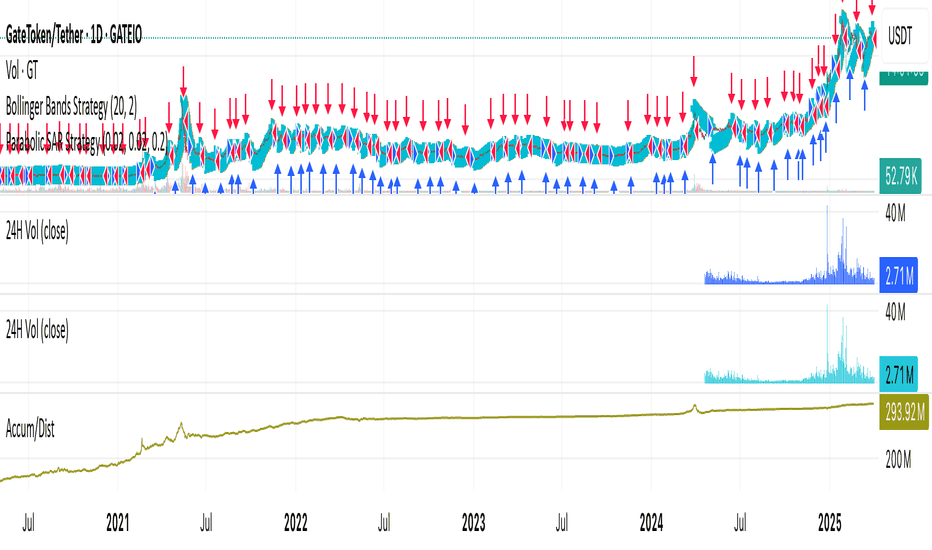
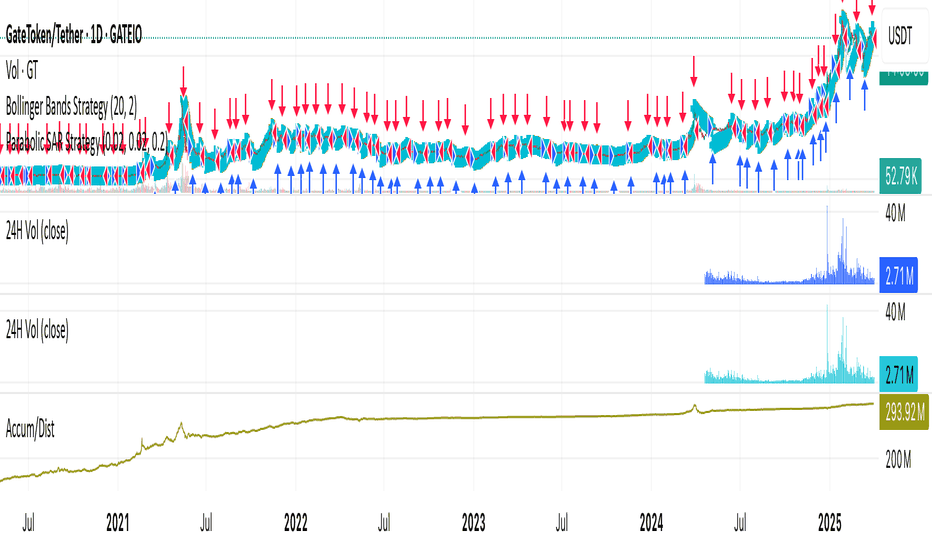
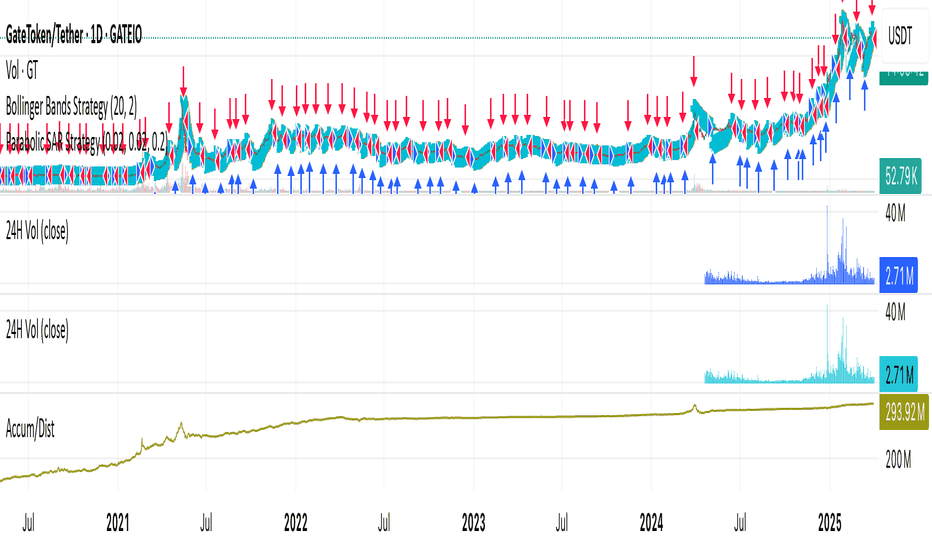
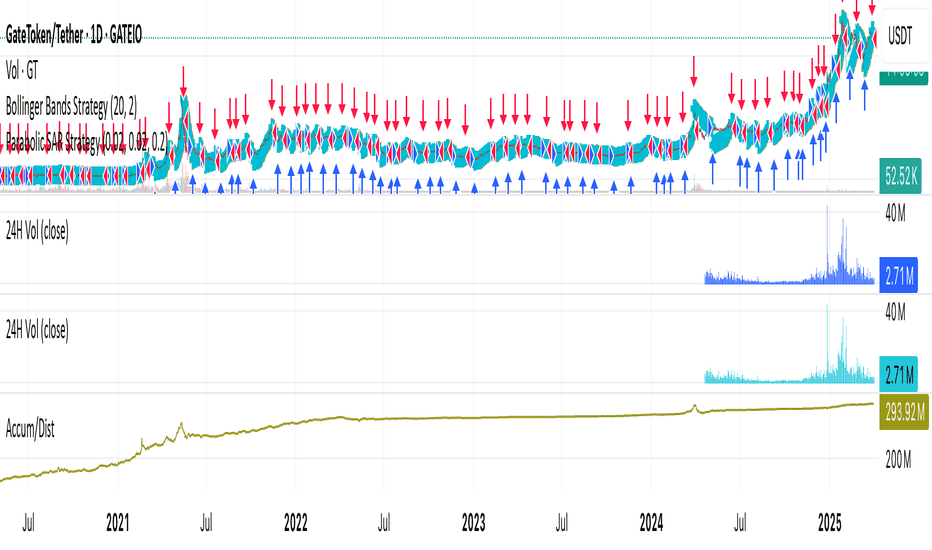
GT's StochRSI on the weekly chart has formed a golden cross in the oversold zone, signaling a strong bullish trend with a target of $100. The descending pressure line from previous highs has been decisively broken, indicating reduced resistance and opening up upside potential. With multiple bullish candles on the daily chart, buying momentum is clearly dominant....
Alpha isn't free. If someone’s giving you gems 24/7 with no filter, no delay, no gate... Chances are: You're the liquidity. Trade on Gate—where you’ll find all the coins you want, with over 3,700+ spot trading pairs available!
Karma hit fast. Hacker steals 2,930 ETHETH CRYPTOCAP:ETH ($5.4M) from zkLend... then gets phished while using Tornado Cash. All 2,930 ETHETH CRYPTOCAP:ETH ($5.4M) gone — to another thief. Trade ETHETH CRYPTOCAP:ETH , come to Gate – no need to think of reasons, just a pure recommendation! 😄
Remember that whale (or institution) who made a big move buying EIGEN last year? They’re not doing so well 😂 They started with 32.45MinUSDC,bought8.917MEIGEN at an average price of 3$3.64, and lost 17.19M.ThentheyswitchedpartoftheirpositiontoHYPE at the peak, only to lose another $5.21M. Now, after just 5 months, their original 32$32.45M is worth only $10.03M...
On the four major exchanges - Binance, ByBit, OKX, Gate.io,and Deribit - the average funding rate has dropped into negative territory, currently, the metric is just above zero. In this cycle, in four similar instances it ended with a price increase and once with a decline. The corporate sector is actively buying coins, spot market selling pressure is minimal,...
OMFG, can you even process this?! Last night we were mooning with "ACT to da moon", woke up today to "ACT to the underworld" — a 1.05M USDT spot dump CRUSHING a $200M market cap?! Thanos-level efficiency right there! Here's the tea: Binance pulled a double whammy (slashing position limits overnight), triggering whale tantrums — "You cap my bags? I'll nuke the...
While volume has not spiked dramatically, the lack of heavy selling during rallies indicates low resistance to higher prices, supporting the bullish thesis.
The combination of technical breakouts and bullish candlestick patterns suggests a shift in trader sentiment. This emotional pivot often fuels further gains as momentum attracts new buyers.
The StochRSI’s position in the oversold zone prior to the golden cross indicates extreme pessimism has faded, setting the stage for a relief rally driven by renewed optimism.
The broader uptrend remains intact, with key technical levels holding firm. The breakout above resistance adds confidence that the rally toward $100 is sustainable.
The absence of significant volume during potential pullbacks suggests limited downside risk. Buyers appear committed, which could cap any corrective moves.
Recent daily candles for GT have consistently closed bullish, reflecting buyer dominance. This sustained upward momentum supports the case for higher prices ahead.
GT has successfully broken above the descending resistance line, signaling a shift in market structure. This breakout often precedes further upside movement, reinforcing the bullish outlook.
The StochRSI on the weekly chart has formed a golden cross in the oversold zone, indicating a strong bullish reversal signal. This suggests upward momentum could continue, targeting $100.
The recent breakout above the descending resistance aligns with a Fibonacci extension level, providing a confluence of technical validation for the $100 target. Fibonacci retracements and extensions are widely used by traders to identify high-probability price movements. With GT now trading above this critical level, the path of least resistance points higher,...
The StochRSI golden cross in the oversold zone on the weekly chart is not just a technical signal—it often reflects institutional accumulation at extreme levels. Historically, such patterns have preceded sustained rallies as smart money enters during periods of panic selling. Combined with the breakout above the descending resistance line, this suggests...
Over 6Minshortpositionsclusterbetween6Minshortpositionsclusterbetween22.00-$22.50 – a breakout could trigger cascading buybacks.
Crypto exchanges recorded net withdrawals of 8.2M GT this week, indicating holders anticipate higher prices.


