SBI day chart where strong support zone is : 568 Below it goes weak Resistance zone is : 605 which is swing high
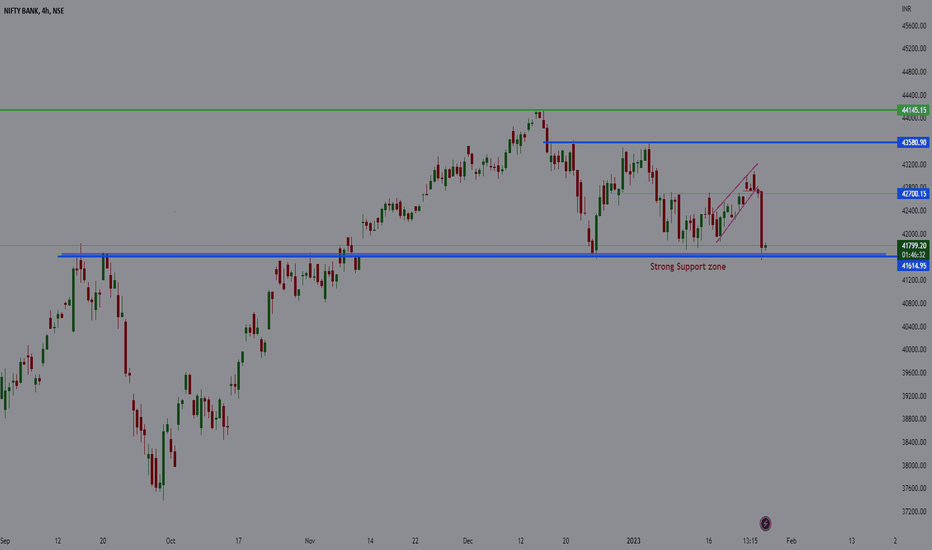
Banknifty is again comes at strong support zone from the last month it is taking support here if this level got breaks down then a huge fall can expect.
Hey traders This healthcare stock is making Ascending triangle pattern on Weekly timeframe chart Resistance zone is 4615 (+-20) levels Support zone is trendline where strong support zone is 3650 zone.
Hey guys this is day chart of Sun Pharma and this stock is trading at resistance zone 1060...and support zone is 975
Hey traders DOW JONES 30 is bounce back from it's strong demand zone and now it close at 33400 level which is resistance in previous sessions will not short until it close below 32500 level
-Tata motors is making descending triangle pattern on daily timeframe chart whereas strong support zone is 370-375 it's also discussed in previous post. wait for the breakout of trendline or price comes to near support zone. If you get benefits from the post then Don't forget to do like and comments.. Thanking you
Indus tower breakdown it's strong support zone 182 and now it is trading below this level so now 182 level react as resistance zone I will short this stock when price comes to near resistance zone with small stop loses.
Bandhan bank is making triangle pattern on daily timeframe chart, I am when price sustain above 255 level now it is trading at trendline resistance so keep eyes on it if it reject from here then we can get shorting opportunity.
Banknifty breaks it's Resistance which is hurdle from last 15days Now I'm expecting a good move in upside as banking stocks giving good results but the budget date is near so be carefull. may be it again come to 42700 for retest then we can enter. I'm bullish until it sustain above 42700 level


