2025/02/25 - 9th Calendar Week 2025
Another 48h - Another Bearish Day With -0.39% Today
“no new weekly low but price action was trending bearish!
will we experience new lows tomorrow? if so, how deep?”
Shortly before the eagerly awaited quarterly results of the chip giant Nvidia
Topic number one remains the uncertainty about US President Donald Trump's policies and the concern that this will leave its mark on the global economy with tariffs and other restrictions. Once again the focus was on the chip sector. The Bloomberg news agency, citing sources, reported that the US government was planning to tighten restrictions and also put pressure on important companies in other countries. And/Or also CNN reported yesterday: "President Donald Trump is eyeing a “25% or higher” tariff on all semiconductor chips the United States imports, with rates likely to “go very substantially higher over a course of a year,” he told reporters on Tuesday." So it was and/or still is not surprising that chip stocks were among the biggest losers today. So the market's caution about Nvidia's
- Will The Bulls Come Back Above 107.348 Points, The Annual High Of 2023?
That was the question of the last 8th calendar week. And we have to answer this question with NO - because the last price action on Friday, the 21st february 2025 was 106.641 points. Answering this question was instructive because a price action below would and will also retrospectively confirm the trend reversal formation of the price action development above the annual high of 2023, namely even the 107.348 points.
“The main obstacle to further progress on the resource curse is China, and to a lesser extent India.”
George Soros
- Will The Bears Defend The Terrain Under 107.348 Points Once Again This Week?
This is the question of this 9th calendar week. And it is important because it would confirm the trend reversal formation above the 2023 annual high, at just 107.348 Points points, in the second week in a row.
110.176 : 2025/01/13 - Annual High 2025
108.583 : 2024/12/31 - Annual High 2024
107.348 : 2023/10/03 - Annual High 2023
106.621 : 2025/02/25 - last price action
105.441 : 2024/11/06 - Trump Re-Election Day
Traders and/or investors only sent the DXY
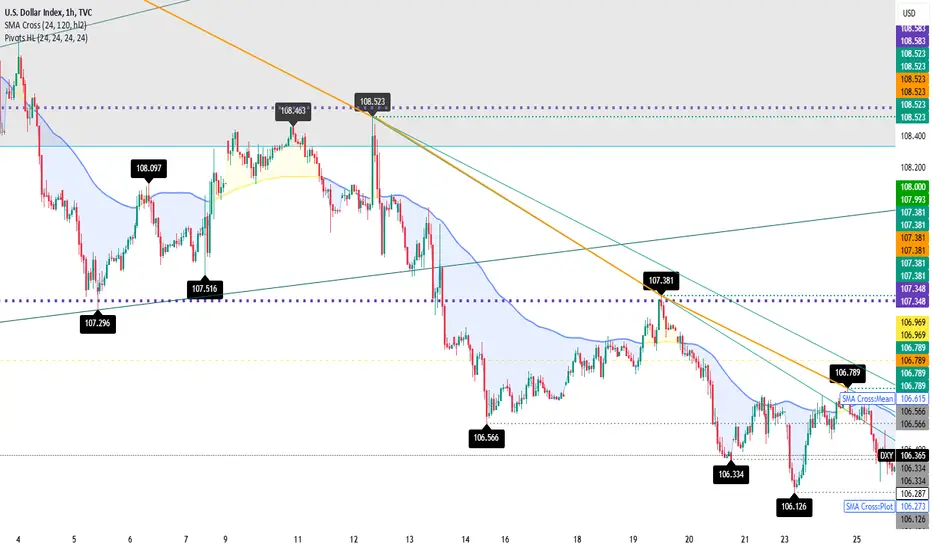
109.881 : 2025/02/02 - 1st Short Downtrend 1st Leg
108.523 : 2025/02/12 - 1st Short Downtrend 2nd Leg
108.523 : 2025/02/12 - 2nd Short Downtrend 1st Leg
107.381 : 2025/02/19 - 2nd Short Downtrend 2nd Leg
107.381 : 2025/02/19 - 3rd Short Downtrend 1st Leg
106.789 : 2025/02/24 - 3rd Short Downtrend 2nd Leg
106.789 : 2025/02/24 - This Week High
106.566 : 2025/02/14 - Last Week Before Low
106.334 : 2025/02/20 - Last Week Low
106.287 : 2025/02/25 - last price action
106.126 : 2025/02/23 - This Week Low
Be that as it may, in addition to the general picture this week, if we analyze the price action in a little more detail without losing track at the same time, the three short-term downward trends are groundbreaking. Why? Because yesterday i.e. the trading session closed round about the extended 2ns Short Downtrend Line around 106.669 points. Maybe that's why we had a relatively bearish trading day today. Namely, with a minus of -0.39%. So that traders and/or investors sent the price action over the course of the day both below the low of the week before last - 106.566 points from the 14th February 2025 - and below the low of last week - 106.334 points from the 20th February 2025. However, basically a little good news for the bulls that the not to a new weekly low - today's low at 106.189 points was higher than yesterday's low at 106.126 points. And what does that tell us? The bears are back - but the bulls are still fighting! Albeit at a low level when it comes to price action in the first two trading days of this 9th calendar week. Therefore, my basic assumption remains to prefer the bearish side. Even I will not and/or can not rule out the strength of the bulls to send the DXY
With best wishes
and good intentions:
Aaron
Another 48h - DXY ... is pure information material.
By trying to give you even more information about the
Related publications
Disclaimer
The information and publications are not meant to be, and do not constitute, financial, investment, trading, or other types of advice or recommendations supplied or endorsed by TradingView. Read more in the Terms of Use.
Related publications
Disclaimer
The information and publications are not meant to be, and do not constitute, financial, investment, trading, or other types of advice or recommendations supplied or endorsed by TradingView. Read more in the Terms of Use.