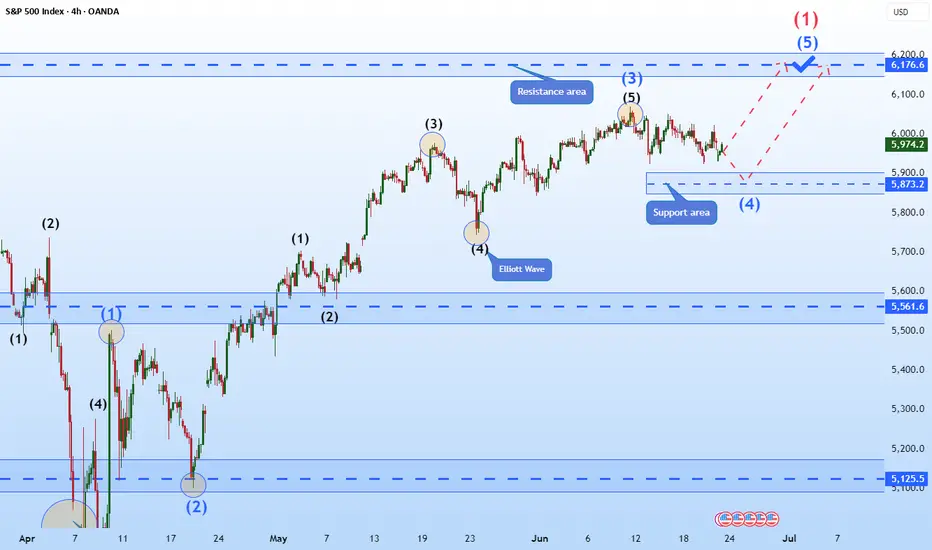
Hellena | SPX500 (4H): LONG resistance area of 6176 (Wave 1).Colleagues, the previous forecast remains essentially unchanged, and the target is still 6176, but I think the forecast can be updated because the price has been flat for quite some time.
I still expect the upward movement to continue in the large wave “1” and in the medium-order wave “5”.
A small
About S&P 500
Related indicators
S&P500 Potential UpsidesHey Traders, in today's trading session we are monitoring US500 for a buying opportunity around 6,075 zone, S&P500 is trading in an uptrend and currently is in a correction phase in which it is approaching the trend at 6,075 support and resistance area.
Trade safe, Joe.

Nasdaq All-Time Highs, S&P Close, Blast Off or Breakdown?What an incredible melt-up since April 7 lows in the US markets.
Trump vs Musk - ignored
Iran vs Israel - ignored
High Valuations - ignored
FED Pausing - ignored
The US economy is resilient and it's a good thing because the world is performing really well (EX-US). Europe/China/India/Emerging Marke

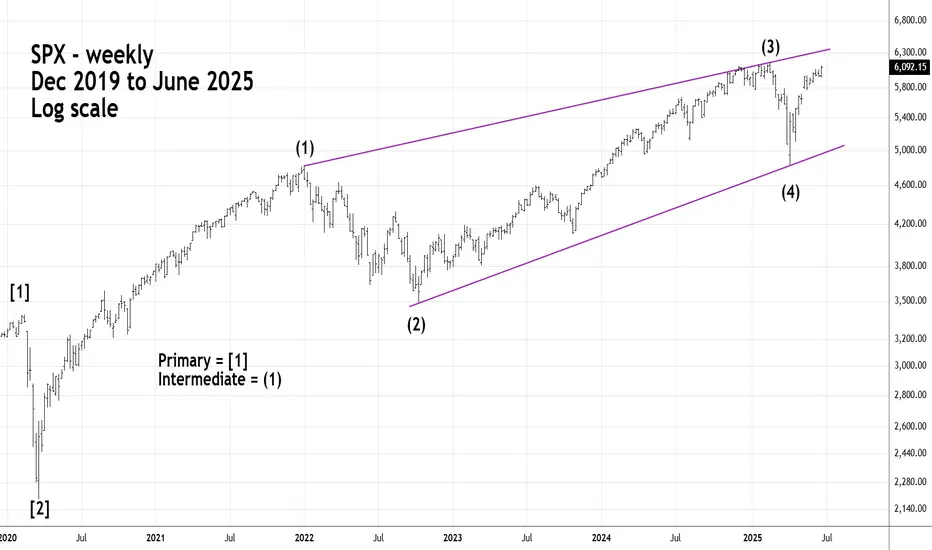
Long - Term S&P 500 - Elliott Imulse WaveThe S&P 500 - (SPX) could soon complete a five - year Elliott Impulse wave that began in March 2020.
Fibonacci resistance is in the SPX 6,200 area which could be reached on 06/26/25 or 06/27/25.
S&P500 1D Golden Cross, middle of 3y Channel, much upside to go!The S&P500 index (SPX) has been trading within a Channel Up since the final sell-off of the 2022 Inflation Crisis. The only time this pattern broke was for 4 days during the bottom formation (April 2025) of the recent Trade War.
Ahead of the first 1D Golden Cross since January 26 2023, the market l

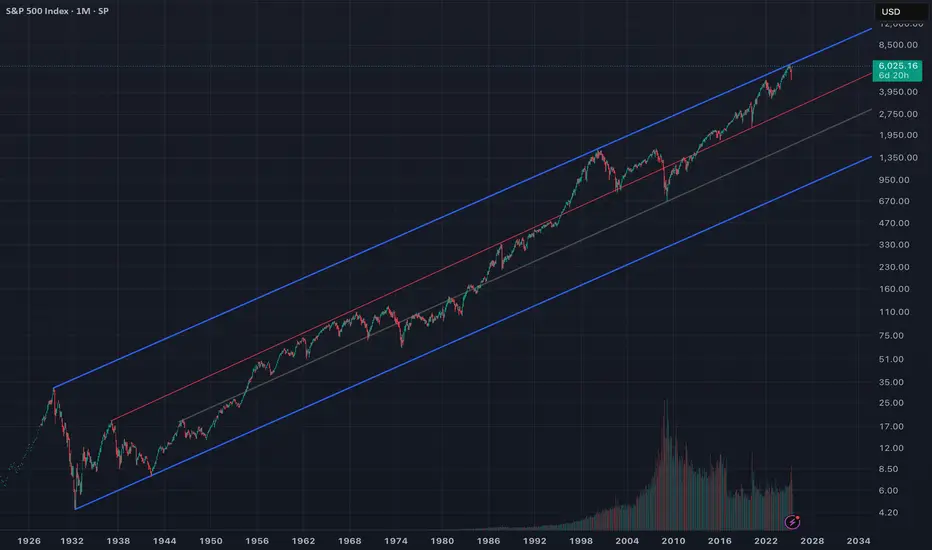
🇺🇸 America at the Crossroads: Golden Age or Great Reset? As the S&P 500 crosses 6,000 , investors celebrate yet another all-time high. But beneath the surface of this rally lies an uncomfortable truth: we are standing at a national and market inflection point.
This isn’t just another leg up. This is the top of a century-long trend channel, a moment wh
The Midyear Mindset Reset: Reboot Your Trading Before Q3Because nothing says "trader growth" like admitting you’ve been winging it for six months.
👋 Welcome to Halftime — How’s Your P&L Looking?
June’s closing bell isn’t just a date on the calendar — it’s that awkward moment where traders stare into the middle distance, coffee in hand, and quietly wh

S&P 500 Futures Rise on Ceasefire Relief, Eyes on Fed PowellSPX500 OVERVIEW
U.S. Futures Rise as Ceasefire Eases Tensions, Focus Turns to Powell
U.S. stock futures climbed on Tuesday, with S&P 500 futures up 0.8%, extending gains from the previous session as Middle East tensions eased following a ceasefire announcement.
President Trump confirmed a ceasefi

S&P500 and Nasdaq Short: Wave 5 <= Wave 3Based on the Elliott Wave rule that wave 3 is not the shortest wave, I gave a projection on where the peak of both S&P500 and Nasdaq could be. Based on these peaks, the stop is set above and the take profit target is where wave 4 was.

SPX500: Bearish Momentum Below 5966, Bullish Recovery Above 6010SPX500 – Technical Overview
SPX500 is currently exhibiting bearish momentum, largely driven by escalating tensions in the Middle East, which are contributing to heightened market volatility.
At present, the price is approaching the pivot level at 5966. A confirmed 1-hour candle close below this le

See all ideas