This chart reveals one of the most significant setups in crypto - the ETH/BTC ratio bottoming at historical support and poised for a powerful mean reversion.
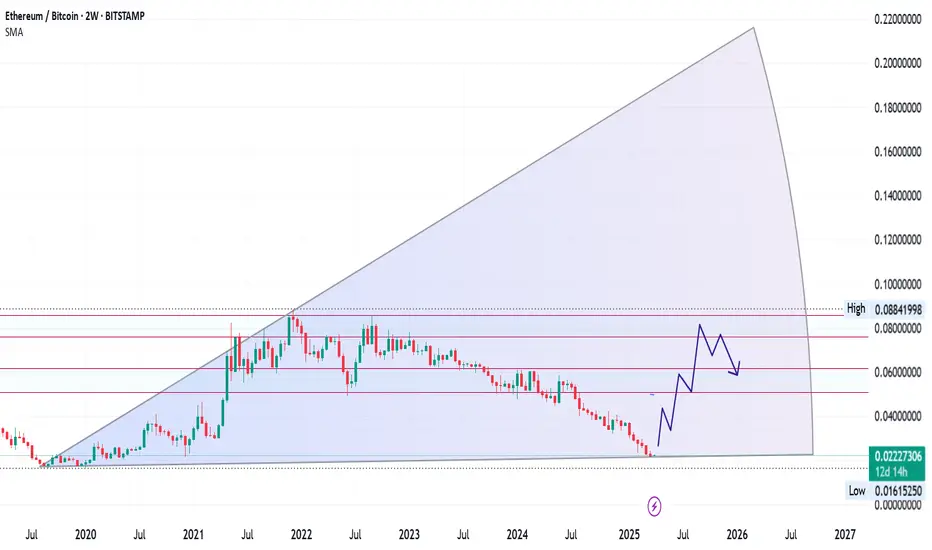
After a sustained downtrend through 2023-2024, the ETH/BTC pair has reached a critical inflection point at 0.0222, precisely where smart money accumulates. This level represents structural support dating back to 2020, creating the perfect foundation for a macro reversal.
Technical Structure:
- Perfect technical bottom at long-term channel support
- Currently at 0.0222 (near historical demand zone)
- SMA at 0.0496 providing clear target for initial move
- Projected 3-wave structure targeting 0.07 zone (+250% potential)
#Market Thesis:
We're witnessing the completion of a multi-year corrective phase that has reset ETH/BTC valuations to extreme levels. The projected path shows a powerful rally into mid-2025, targeting the previous resistance zone around 0.07.
Strategic Implications:
The ETH/BTC ratio acts as the perfect hedge against Bitcoin dominance decline. When capital rotates from Bitcoin into altcoins, Ethereum historically captures the first wave of this rotation before smaller caps.
Historical Context:
Every major crypto bull cycle has featured periods where Ethereum dramatically outperforms Bitcoin. The technical structure suggests we're entering exactly such a phase, with timing that aligns perfectly with post-halving capital rotation patterns.
This isn't just another trade - it's positioning for the major narrative shift of 2025.
Related publications
Disclaimer
The information and publications are not meant to be, and do not constitute, financial, investment, trading, or other types of advice or recommendations supplied or endorsed by TradingView. Read more in the Terms of Use.
Related publications
Disclaimer
The information and publications are not meant to be, and do not constitute, financial, investment, trading, or other types of advice or recommendations supplied or endorsed by TradingView. Read more in the Terms of Use.