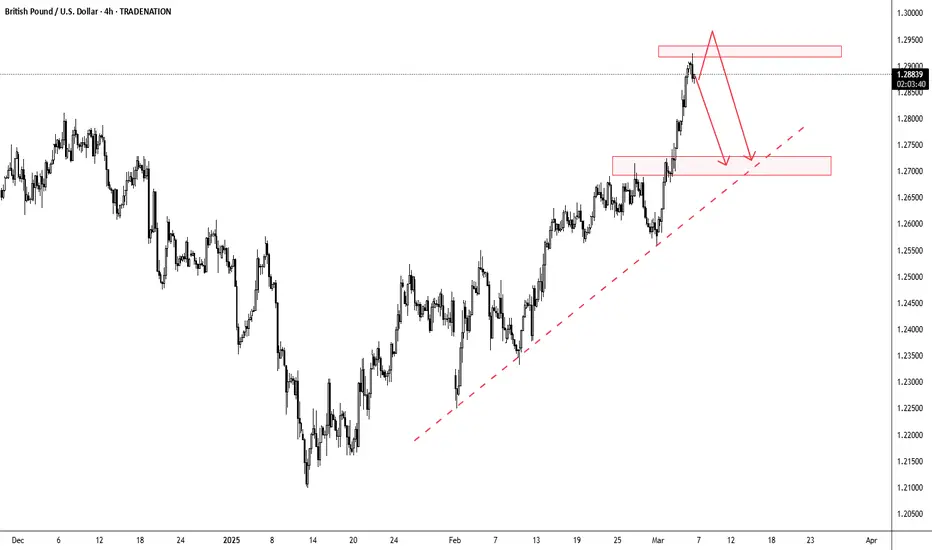
The GBP/USD pair has exhibited a strong bullish trend since its January lows, currently trading at 1.2876. After reaching recent highs, the price is now at a critical decision point as shown by the chart's resistance area (upper red box) and ascending trendline. The sharp upward movement followed by the recent pullback suggests potential exhaustion of buying momentum, with the red downward-pointing arrows indicating a possible corrective phase ahead.
Two scenarios appear most likely from this technical formation: either price continues higher to break above the upper resistance box before initiating a correction, or an immediate correction begins from current levels. In both cases, the lower orange box around the 1.2700-1.2720 area serves as a reasonable target, as does the ascending trendline (marked by the red dashed line) that has supported the uptrend since January. Traders should watch for potential reversal signals or consolidation patterns to confirm which scenario is unfolding. As always don't jump into trades and wait for confirmation!
Disclosure: I am part of Trade Nation's Influencer program and receive a monthly fee for using their TradingView charts in my analysis.
Disclaimer
The information and publications are not meant to be, and do not constitute, financial, investment, trading, or other types of advice or recommendations supplied or endorsed by TradingView. Read more in the Terms of Use.
Disclaimer
The information and publications are not meant to be, and do not constitute, financial, investment, trading, or other types of advice or recommendations supplied or endorsed by TradingView. Read more in the Terms of Use.