GBPUSDHello Traders! 👋
What are your thoughts on GBPUSD?
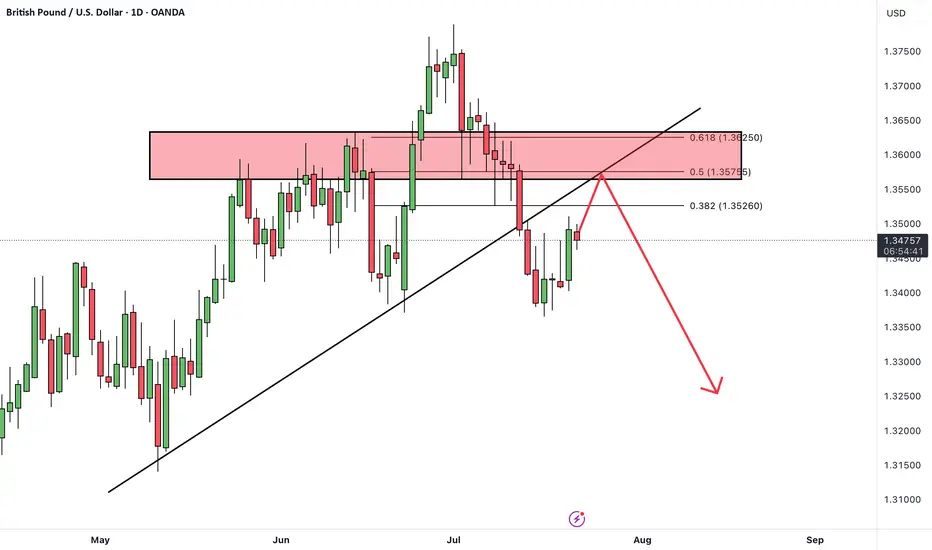
GBP/USD has broken support zone and its ascending trendline, indicating a shift in momentum.
The pair is currently in a pullback phase, retesting the broken support zone, which now acts as resistance.
Once the pullback is complete, we expect furth
About British Pound / U.S. Dollar
GBPUSD, often referred to as “The Cable”, a foreign exchange term used to describe the British pound vs the US dollar, is one of the oldest traded currency pairs. In July of 1866, after an earlier failed attempt, the first reliable exchange rate between the British pound and the US dollar was transmitted between the London and New York Exchanges. Optic fibre cables accompanied by satellites handle the Transatlantic communications today.
Related currencies
GBPUSD: A Bearish Outlook on the Daily ChartGBPUSD: A Bearish Outlook on the Daily Chart
On the daily chart, GBPUSD looks like it is preparing to start a downtrend.
I don’t expect GBPUSD to fall that easily. It is likely to wait for the FOMC meeting at the end of the month before starting a bearish wave.
At this point, GBPUSD could be in

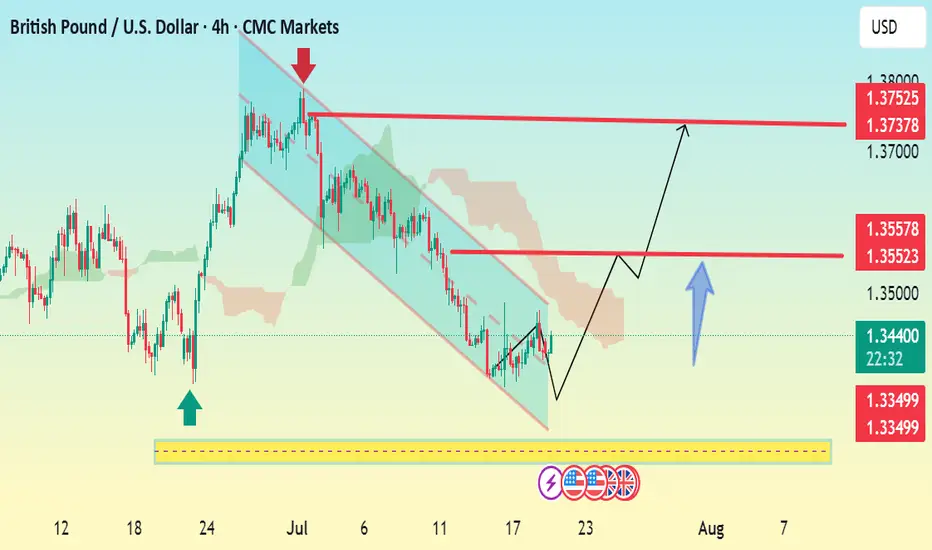
GBP/USD 4H Bullish Reversal Setup Analysis:The chart shows GBP/USD breaking out of a descending channel, signaling a potential bullish reversal.
Price has bounced from a strong support zone (highlighted in yellow), with bullish momentum building.
The breakout is backed by a higher low structure, which often precedes an uptrend continuation
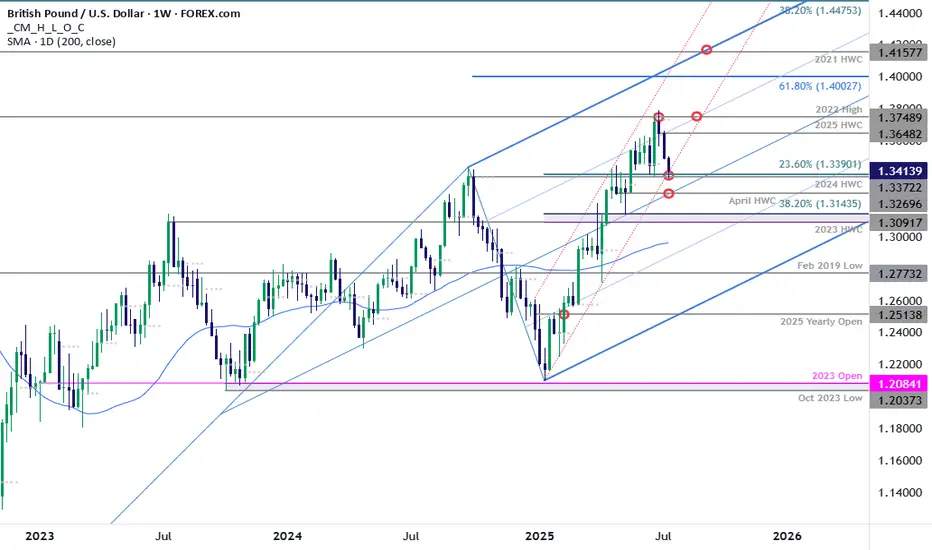
GBP/USD Plunges to Make-or-Break SupportSterling is poised to mark a third consecutive weekly decline after turning from resistance at multi-year highs. The decline takes price into critical support at the yearly trendline- this is a make-or-break level for the bulls.
GBP/USD is testing confluent support today at 1.3372/90- a region defi
GBPUSD → Hunting for liquidity before the fallFX:GBPUSD is forming a countertrend correction towards the liquidity zone amid a correction in the dollar. Are there any chances for a trend break?
The currency pair is taking advantage of the opportunity to test the trend resistance and consolidation amid the dollar correction. Focus on the n

GBPUSD I Its ready for the deeper pullback - COT OverviewHey what up traders welcome to the COT data and Liquidity report. It's always good to go with those who move the market here is what I see in their cards. I share my COT - order flow views every weekend.
🎯 Non Commercials added significant longs and closed shorts at the same time. So for that reas

GBPUSD Potential UpsidesHey Traders, in today's trading session we are monitoring GBPUSD for a buying opportunity around 1.33900 zone, GBPUSD is trading in an uptrend and currently is in a correction phase in which it is approaching the trend at 1.33900 support and resistance area.
Trade safe, Joe.

22.07.25 Morning ForecastPairs on Watch -
FX:GBPJPY
FX:AUDUSD
OANDA:XAUUSD
FX:GBPUSD
A short overview of the instruments I am looking at for today, multi-timeframe analysis down to what I will be looking at for an entry. Enjoy!

Short Opportunity on GBPUSD – Technical & Fundamentals AlignToday I want to look at the Short position opportunity in GBPUSD ( FX:GBPUSD ). So let's take a look at the GBPUSD pair from a fundamental and technical perspective.
Fundamental Analysis:
The British Pound remains under pressure due to growing expectations of a 25–50 bps rate cut by the

GBPUSD Trading The Gap # Revised GBP/USD London Session Bullish Setup
---
Market Context
- Price gapped up into the **breaker zone at 1.34160–1.34190, now acting as support.
- The Asian session rallied into the 0.25 **quadrant of the 4-hour wick** (not the daily range) before stalling and retracing.
- A buy-side im

See all ideas
Summarizing what the indicators are suggesting.
Oscillators
Neutral
SellBuy
Strong sellStrong buy
Strong sellSellNeutralBuyStrong buy
Oscillators
Neutral
SellBuy
Strong sellStrong buy
Strong sellSellNeutralBuyStrong buy
Summary
Neutral
SellBuy
Strong sellStrong buy
Strong sellSellNeutralBuyStrong buy
Summary
Neutral
SellBuy
Strong sellStrong buy
Strong sellSellNeutralBuyStrong buy
Summary
Neutral
SellBuy
Strong sellStrong buy
Strong sellSellNeutralBuyStrong buy
Moving Averages
Neutral
SellBuy
Strong sellStrong buy
Strong sellSellNeutralBuyStrong buy
Moving Averages
Neutral
SellBuy
Strong sellStrong buy
Strong sellSellNeutralBuyStrong buy
Displays a symbol's price movements over previous years to identify recurring trends.
Frequently Asked Questions
The current rate of GBPUSD is 1.35359 USD — it has decreased by −0.17% in the past 24 hours. See more of GBPUSD rate dynamics on the detailed chart.
The value of the GBPUSD pair is quoted as 1 GBP per x USD. For example, if the pair is trading at 1.50, it means it takes 1.5 USD to buy 1 GBP.
The term volatility describes the risk related to the changes in an asset's value. GBPUSD has the volatility rating of 0.40%. Track all currencies' changes with our live Forex Heatmap and prepare for markets volatility.
The GBPUSD showed a 1.00% rise over the past week, the month change is a 0.27% rise, and over the last year it has increased by 4.87%. Track live rate changes on the GBPUSD chart.
Learn how you can make money on rate changes in numerous trading ideas created by our community.
Learn how you can make money on rate changes in numerous trading ideas created by our community.
GBPUSD is a major currency pair, i.e. a popular currency paired with USD.
Currencies are usually traded through forex brokers — choose the one that suits your needs and go ahead. You can trade GBPUSD right from TradingView charts — just log in to you broker account. Check out the list of our integrated brokers and find the best one for your needs and strategy.
When deciding to buy or sell currency one should keep in mind many factors including current geopolitical situation, interest rates, and other. But before plunging into a deep research, you can start with GBPUSD technical analysis. The technical rating for the pair is buy today, but don't forget that markets can be very unstable, so don't stop here. According to our 1 week rating the GBPUSD shows the strong buy signal, and 1 month rating is buy. See more of GBPUSD technicals for a more comprehensive analysis.