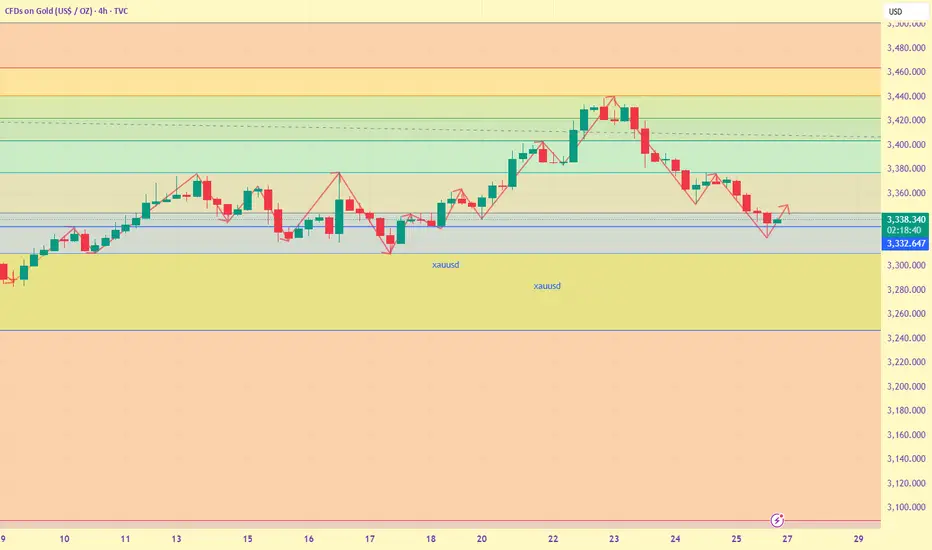
This week, after gold prices were rejected twice and broke through the trend line (which connects the top of the June 16 high of $3,452), bears regained control. A new bearish signal was released. At the same time, gold prices fell for the third consecutive trading day due to the optimism brought by the signs of progress in trade negotiations.
The strong downward momentum pushed gold prices down more than 2.5% in the past three days, giving up more than half of the recent gains in the $3,246-3,438 rising band (Fibonacci 50% retracement level is at $3,342, resonating with the 20-day moving average), and approaching the key support level of $3,323 (the top of the Ichimoku cloud on the daily chart).
If gold falls below the key support level of $3,320 (trend line support/Fibonacci 61.8% retracement), it will force a large number of longs to leave the market and may further test the $3,308-3,290 range (psychological barrier/Fibonacci 76.4% retracement). Short-term traders need to focus on the reaction of gold prices at the top of the daily cloud, as this is a very important support level that may limit the decline again.
Gold short-term signal analysis:
Resistance: $3,345; $3,357; $3,373;
Support: $3,323; $3,308; $3,295;
 XAUUSD
  XAUUSD
  XAUUSD
  GOLD
GOLD  XAUUSD
  XAUUSD
The strong downward momentum pushed gold prices down more than 2.5% in the past three days, giving up more than half of the recent gains in the $3,246-3,438 rising band (Fibonacci 50% retracement level is at $3,342, resonating with the 20-day moving average), and approaching the key support level of $3,323 (the top of the Ichimoku cloud on the daily chart).
If gold falls below the key support level of $3,320 (trend line support/Fibonacci 61.8% retracement), it will force a large number of longs to leave the market and may further test the $3,308-3,290 range (psychological barrier/Fibonacci 76.4% retracement). Short-term traders need to focus on the reaction of gold prices at the top of the daily cloud, as this is a very important support level that may limit the decline again.
Gold short-term signal analysis:
Resistance: $3,345; $3,357; $3,373;
Support: $3,323; $3,308; $3,295;
Note
Gold reached Henry's 3345 short-selling signal accurately, retreating 20 US dollars per ounce. Traders who paid attention to and executed Henry's plan once again achieved profitability. Note
In a complex market, choosing the right direction is your only way to win.Note
In a complex market, choosing the right direction is your only way to win.Note
Gold fell by $40/ounce, in line with Henry's expected targetGood at solving all trading problems, doubling the account in a week, and making a stable profit of 300% in a month
🚀Private VIP: t.me/HenryDovitt
👍Market exclusive signal: t.me/Henryffjyfylffc108
🚀Private VIP: t.me/HenryDovitt
👍Market exclusive signal: t.me/Henryffjyfylffc108
Disclaimer
The information and publications are not meant to be, and do not constitute, financial, investment, trading, or other types of advice or recommendations supplied or endorsed by TradingView. Read more in the Terms of Use.
Good at solving all trading problems, doubling the account in a week, and making a stable profit of 300% in a month
🚀Private VIP: t.me/HenryDovitt
👍Market exclusive signal: t.me/Henryffjyfylffc108
🚀Private VIP: t.me/HenryDovitt
👍Market exclusive signal: t.me/Henryffjyfylffc108
Disclaimer
The information and publications are not meant to be, and do not constitute, financial, investment, trading, or other types of advice or recommendations supplied or endorsed by TradingView. Read more in the Terms of Use.
