GOLD → Retesting resistance may lead to a breakout.FX:XAUUSD breaks the downward resistance line on the senior timeframe and tests the upper limit of the trading range amid the falling dollar and Powell's speech. The metal may continue its upward movement.
The dollar's rise was short-lived after Fed Chairman Jerome Powell hinted at an imminent
About Gold Spot / U.S. Dollar
Gold price is widely followed in financial markets around the world. Gold was the basis of economic capitalism for hundreds of years until the repeal of the Gold standard, which led to the expansion of a flat currency system in which paper money doesn't have an implied backing with any physical form of monetization. AU is the code for Gold on the Periodic table of elements, and the price above is Gold quoted in US Dollars, which is the common yardstick for measuring the value of Gold across the world.

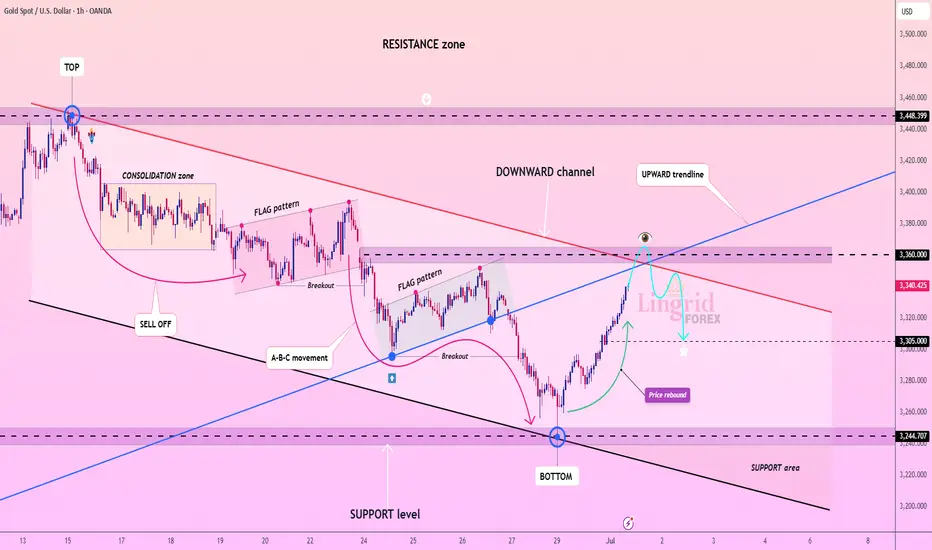
Lingrid | GOLD Shorting Opportunity at Confluence ResistanceOANDA:XAUUSD is approaching the key resistance near 3360 after rebounding from the 3245 support level and breaking out of the downward channel. Price is now testing the upward trendline from below, intersecting with the red descending trendline and horizontal resistance. If this confluence zone rej
GOLD → Recovery and retest of resistance. DowntrendFX:XAUUSD has been recovering since the start of the session thanks to a weak dollar, but further growth is uncertain. However, the price is still below the key range and important levels.
At the beginning of the week, gold rebounded from monthly lows amid a weakening US dollar, which remains

GOLD: Nothing Changed, Still BearishGOLD: Nothing Changed, Still Bearish
At the moment, gold is following developments in the Middle East. The geopolitical situation seems to have improved, thus creating a short-term release of liquidity in long gold positions.
It could be a short-term gain, but there could also be a larger wave th

Lingrid | GOLD Pre-NFP Price Action AnalysisThe price perfectly fulfilled my last idea . OANDA:XAUUSD rebounded strongly from the 3244 support area, breaking above the downward trendline and pushing into the mid-resistance band. The price is currently testing 3353 and could pull back slightly before retesting the 3388 key resistance level

Lingrid | GOLD Weekly Analysis: Risk-Off Trade Unwinds OANDA:XAUUSD endured another challenging week as the Iran-Israel ceasefire continued to diminish safe-haven demand, while robust equity market performance drew capital away from precious metals. The risk-on environment has fundamentally shifted investor priorities, with growth assets overshadowing

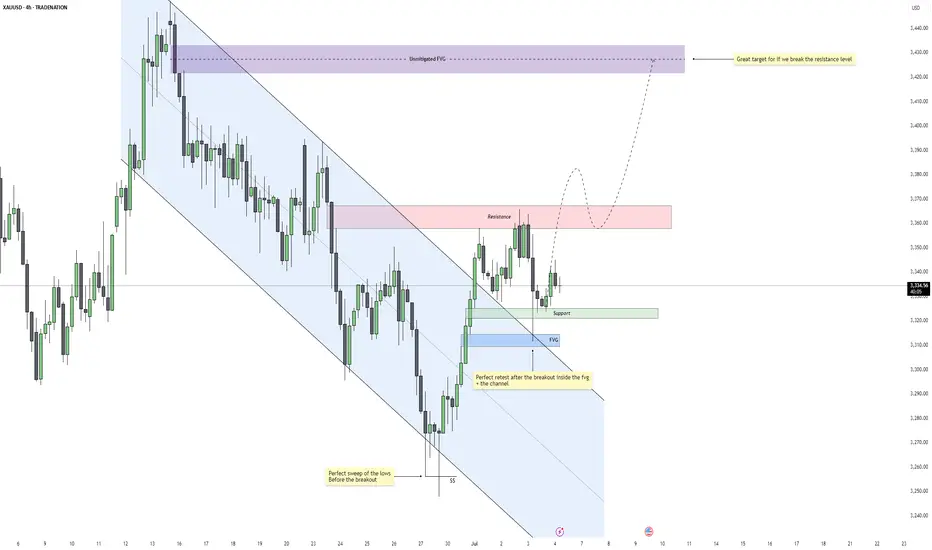
Gold – Is $3430 the Next Target After This Breakout?Gold recently completed a clean sweep of the 4H swing lows, taking out downside liquidity just before breaking out of a well-defined descending channel. This move marked a shift in momentum and structure, suggesting that the bearish leg may have concluded and the market is now transitioning into a m
Trading Signal for (XAU/USD) sell below $3,359 (21 SMA-7/8 MurraEarly in the European session, gold is trading around 3,341, below the 7/8 Murray and above the 21 SMA and the 200 EMA, with a bullish bias.
We can see that gold reached the 7/8 Murray level on the H4 chart. This has become strong resistance, so we believe a technical correction could occur below t
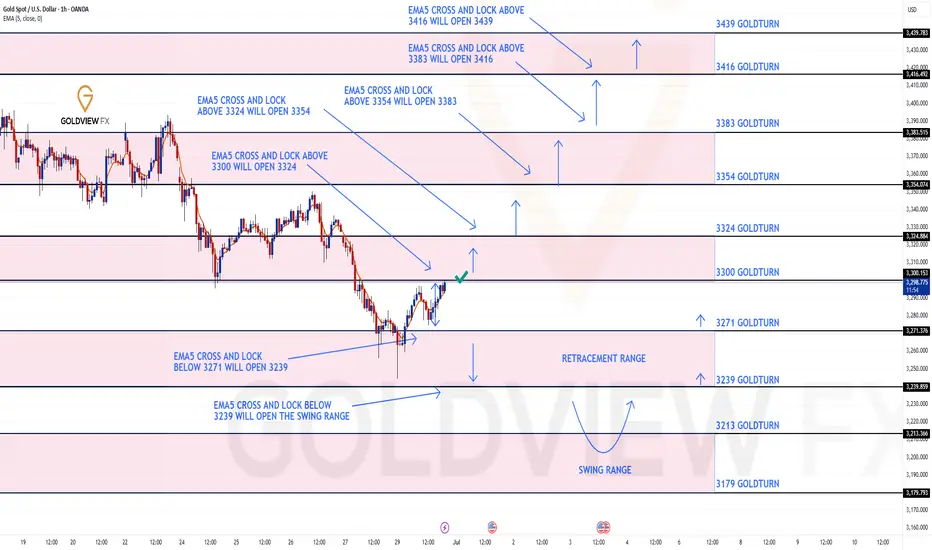
GOLD ROUTE MAP UPDATEHey Everyone,
Great start to the week with our Bullish target at 3300 hit perfectly!!!!
We will now look for ema5 cross and lock to confirm a continuation or failure to lock will follow with a rejection into the lower Goldturns for support and bounce.
We will see levels tested side by side until
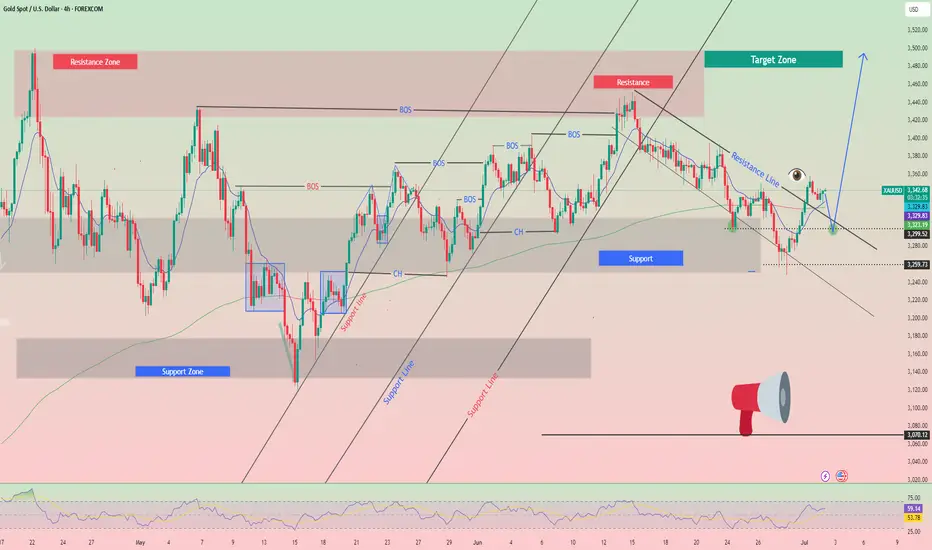
XAUUSD : Bull or Bear ? (READ THE CAPTION)By analyzing the gold chart on the 4-hour timeframe, we can see that the price continued its correction yesterday, dropping to as low as $3327. However, gold rebounded and is currently trading around the $3344 level.
The key condition for further bullish movement is a stable hold above $3338. If th

See all ideas
Summarizing what the indicators are suggesting.
Oscillators
Neutral
SellBuy
Strong sellStrong buy
Strong sellSellNeutralBuyStrong buy
Oscillators
Neutral
SellBuy
Strong sellStrong buy
Strong sellSellNeutralBuyStrong buy
Summary
Neutral
SellBuy
Strong sellStrong buy
Strong sellSellNeutralBuyStrong buy
Summary
Neutral
SellBuy
Strong sellStrong buy
Strong sellSellNeutralBuyStrong buy
Summary
Neutral
SellBuy
Strong sellStrong buy
Strong sellSellNeutralBuyStrong buy
Moving Averages
Neutral
SellBuy
Strong sellStrong buy
Strong sellSellNeutralBuyStrong buy
Moving Averages
Neutral
SellBuy
Strong sellStrong buy
Strong sellSellNeutralBuyStrong buy
Displays a symbol's price movements over previous years to identify recurring trends.