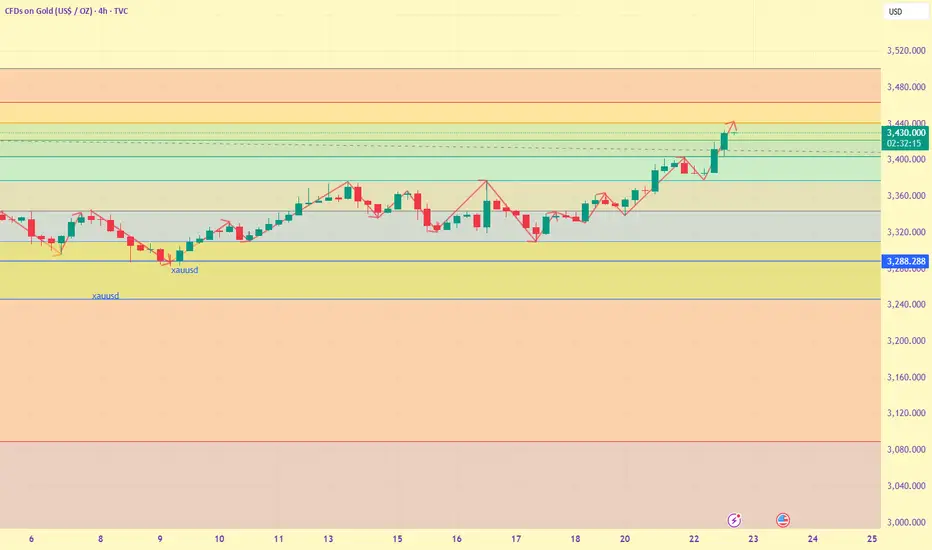
From a technical perspective, gold has broken through the $3,423 resistance level, confirming a breakout from the symmetrical triangle pattern that has formed in recent weeks. Both price action and the relative strength index (RSI) show bullish momentum supporting this breakout - the RSI is currently close to 63, indicating that there is still room to go before entering overbought territory. Gold currently maintains a strong bullish structure
Gold prices have firmly established themselves above the 23.6% Fibonacci retracement level of the April low-to-high move ($3,372), with the next resistance level being the June 16 high of $3,452-3,463 (short zone). A sustained break above $3,463.53 would point directly to the all-time high of $3,500.20, especially if Powell makes dovish comments; even if Powell maintains a neutral or cautious stance, disagreements within the Fed may continue to weigh on the dollar, providing support for gold. On the downside, the immediate short-term support is at 3408, and the support is around $3393-3383 (buy long area).
Overall, this breakthrough marks the rekindling of bullish interest in gold, and the daily closing price needs to stand above $3400 to confirm the sustainability of the upward momentum. Before the August 1 trade tariff deadline, the rising risk premium and the uncertainty of the global economy and geopolitics, the gold price forecast is still bullish, with technical and fundamental support.
 XAUUSD XAUUSD XAUUSD XAUUSD XAUUSD GOLD
Gold prices have firmly established themselves above the 23.6% Fibonacci retracement level of the April low-to-high move ($3,372), with the next resistance level being the June 16 high of $3,452-3,463 (short zone). A sustained break above $3,463.53 would point directly to the all-time high of $3,500.20, especially if Powell makes dovish comments; even if Powell maintains a neutral or cautious stance, disagreements within the Fed may continue to weigh on the dollar, providing support for gold. On the downside, the immediate short-term support is at 3408, and the support is around $3393-3383 (buy long area).
Overall, this breakthrough marks the rekindling of bullish interest in gold, and the daily closing price needs to stand above $3400 to confirm the sustainability of the upward momentum. Before the August 1 trade tariff deadline, the rising risk premium and the uncertainty of the global economy and geopolitics, the gold price forecast is still bullish, with technical and fundamental support.
Good at solving all trading problems, doubling the account in a week, and making a stable profit of 300% in a month
🚀Private VIP: t.me/HenryDovitt
👍Market exclusive signal: t.me/Henryffjyfylffc108
🚀Private VIP: t.me/HenryDovitt
👍Market exclusive signal: t.me/Henryffjyfylffc108
Related publications
Disclaimer
The information and publications are not meant to be, and do not constitute, financial, investment, trading, or other types of advice or recommendations supplied or endorsed by TradingView. Read more in the Terms of Use.