Gold Market Technical Analysis and Trading Strategies
Current Trend Analysis
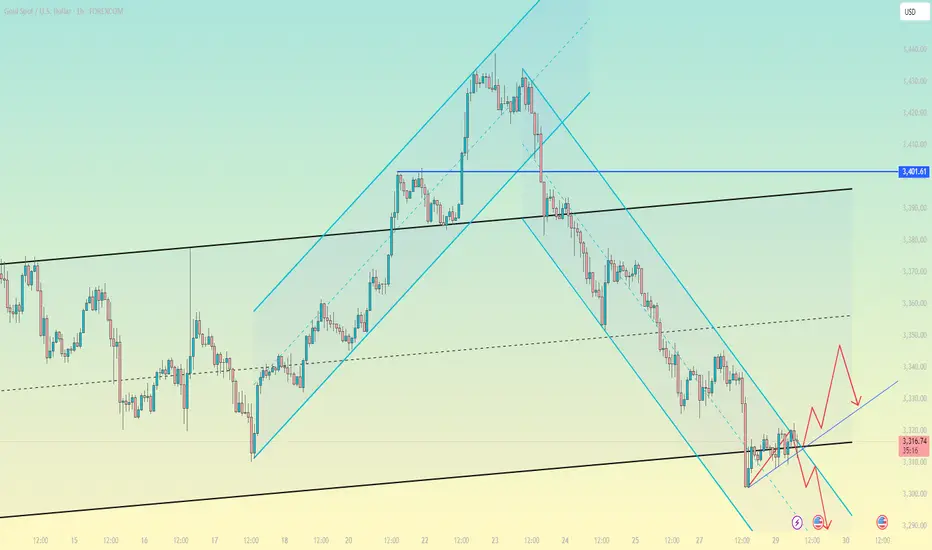
Gold prices entered a technical rebound after testing key support at $3,300 and are currently trading in a narrow range between $3,315 and $3,320. This area constitutes a key bull-bear dividing line, acting as both upper resistance at the hourly chart's descending channel and technical resistance from a previous low. Since retreating from the April high of $3,500, gold prices have fallen 5.7%, primarily due to the Federal Reserve's hawkish stance and a stronger dollar.
Key Price Analysis
Resistance Zone: 3,320-3,325 (upper channel edge + Fibonacci 23.6% retracement level)
Support Level: 3,300, a psychological barrier; a break below could see prices fall to 3,280-3,260.
Bull-Bear Divide: A break above 3,320 could see prices rise to 3,340-3,353; a break below 3,310 would signal a continuation of the trend.
Market Sentiment and Momentum
COMEX net long positions have fallen to a year-to-date low, reflecting subdued market sentiment. The MACD hourly chart shows a bottoming divergence, indicating weakening short-term downward momentum, but shrinking trading volume raises doubts about the sustainability of the rebound. A doji candlestick appears after consecutive negative closes on the daily chart, reflecting a temporary equilibrium between bulls and bears.
Trading Strategy Recommendations
Primary Strategy: Set up short positions on dips under pressure between 3320-3325, with a stop-loss above 3332. Targets are 3310-3305. A break below targets 3280.
Secondary Strategy: Try a small buy position if the price stabilizes at 3315, with a strict stop-loss below 3310 and a target of 3330-3340.
Position Management: Limit risk per trade to 1-2%, with a stop-loss of $6-8.
Risk Warning: Focus on a breakout above the 3315-3320 area. Performance in the European session may indicate the direction of the US market. Be wary of volatility risks arising from changes in US economic data and Fed policy expectations. The medium- to long-term downward trend remains unchanged; strict stop-loss orders are recommended for short-term trading.
Current Trend Analysis
Gold prices entered a technical rebound after testing key support at $3,300 and are currently trading in a narrow range between $3,315 and $3,320. This area constitutes a key bull-bear dividing line, acting as both upper resistance at the hourly chart's descending channel and technical resistance from a previous low. Since retreating from the April high of $3,500, gold prices have fallen 5.7%, primarily due to the Federal Reserve's hawkish stance and a stronger dollar.
Key Price Analysis
Resistance Zone: 3,320-3,325 (upper channel edge + Fibonacci 23.6% retracement level)
Support Level: 3,300, a psychological barrier; a break below could see prices fall to 3,280-3,260.
Bull-Bear Divide: A break above 3,320 could see prices rise to 3,340-3,353; a break below 3,310 would signal a continuation of the trend.
Market Sentiment and Momentum
COMEX net long positions have fallen to a year-to-date low, reflecting subdued market sentiment. The MACD hourly chart shows a bottoming divergence, indicating weakening short-term downward momentum, but shrinking trading volume raises doubts about the sustainability of the rebound. A doji candlestick appears after consecutive negative closes on the daily chart, reflecting a temporary equilibrium between bulls and bears.
Trading Strategy Recommendations
Primary Strategy: Set up short positions on dips under pressure between 3320-3325, with a stop-loss above 3332. Targets are 3310-3305. A break below targets 3280.
Secondary Strategy: Try a small buy position if the price stabilizes at 3315, with a strict stop-loss below 3310 and a target of 3330-3340.
Position Management: Limit risk per trade to 1-2%, with a stop-loss of $6-8.
Risk Warning: Focus on a breakout above the 3315-3320 area. Performance in the European session may indicate the direction of the US market. Be wary of volatility risks arising from changes in US economic data and Fed policy expectations. The medium- to long-term downward trend remains unchanged; strict stop-loss orders are recommended for short-term trading.
Disclaimer
The information and publications are not meant to be, and do not constitute, financial, investment, trading, or other types of advice or recommendations supplied or endorsed by TradingView. Read more in the Terms of Use.
Disclaimer
The information and publications are not meant to be, and do not constitute, financial, investment, trading, or other types of advice or recommendations supplied or endorsed by TradingView. Read more in the Terms of Use.