This chart is an XAUUSD (Gold vs. US Dollar) technical analysis on the 1-hour timeframe, showing price movements and potential future scenarios based on various technical indicators and chart patterns.
Here’s a breakdown and explanation:
🔍 Key Chart Elements:
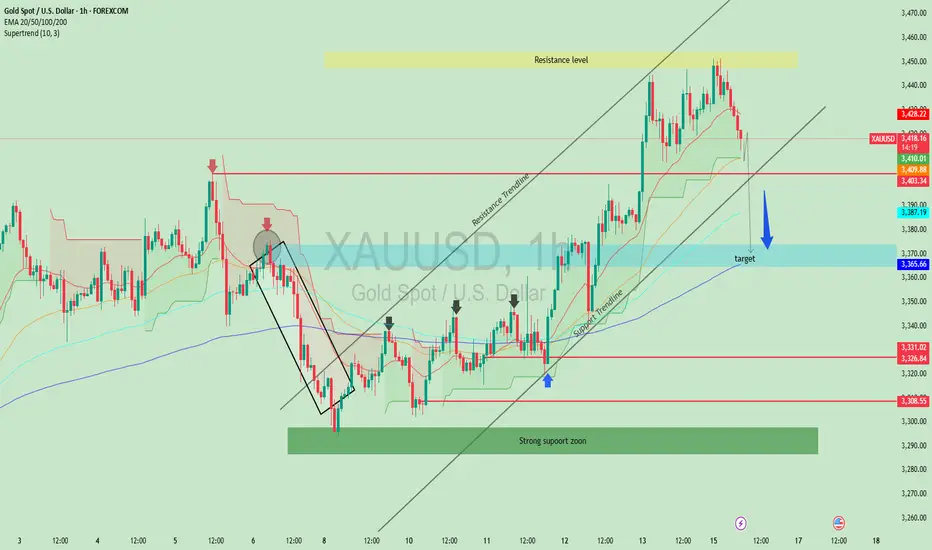
Resistance Level (Yellow Box at Top):
The price recently hit this resistance area (~$3,455–$3,460) and got rejected, indicating strong selling pressure.
Support Zone (Green Box at Bottom):
A strong support zone around $3,290–$3,310 where buyers previously entered the market aggressively.
Trendlines:
Support Trendline (lower black line): Shows the rising trend that has recently been broken.
Resistance Trendline (upper black line): Marks the upper boundary of the previous ascending channel.
Target Zone (Blue Box):
Marked as the next target area around $3,366, near the 200 EMA. This suggests the analyst expects the price to drop toward this zone.
Indicators:
EMA Lines (20/50/100/200): Show current momentum and possible support/resistance. The price is above most of them but appears to be heading toward the 200 EMA.
Supertrend (green/red clouds): Switched to bearish, signaling a potential sell setup.
Candlestick Patterns:
Recent bearish candles indicate selling pressure after hitting resistance.
Red arrows show previous rejection points confirming the resistance.
Blue Arrow:
Suggests the forecasted price direction: a potential drop toward the blue target zone.
📈 Summary / Interpretation:
Current Bias: Bearish in the short term.
Why: Price was rejected at a resistance zone, broke below the support trendline, and is now heading down.
Target: Around $3,366, aligned with previous support and the 200 EMA.
Potential Reaction Zone: Watch the blue zone for a bounce or further breakdown.
💡 Trading Insight:
Bearish Setup: Short opportunities may be valid below the broken trendline, targeting $3,366.
Invalidation: If price climbs back above $3,428 (near resistance), the bearish view may be invalid.
Would you like an updated outlook based on live price data or a longer-term forecast too?
Here’s a breakdown and explanation:
🔍 Key Chart Elements:
Resistance Level (Yellow Box at Top):
The price recently hit this resistance area (~$3,455–$3,460) and got rejected, indicating strong selling pressure.
Support Zone (Green Box at Bottom):
A strong support zone around $3,290–$3,310 where buyers previously entered the market aggressively.
Trendlines:
Support Trendline (lower black line): Shows the rising trend that has recently been broken.
Resistance Trendline (upper black line): Marks the upper boundary of the previous ascending channel.
Target Zone (Blue Box):
Marked as the next target area around $3,366, near the 200 EMA. This suggests the analyst expects the price to drop toward this zone.
Indicators:
EMA Lines (20/50/100/200): Show current momentum and possible support/resistance. The price is above most of them but appears to be heading toward the 200 EMA.
Supertrend (green/red clouds): Switched to bearish, signaling a potential sell setup.
Candlestick Patterns:
Recent bearish candles indicate selling pressure after hitting resistance.
Red arrows show previous rejection points confirming the resistance.
Blue Arrow:
Suggests the forecasted price direction: a potential drop toward the blue target zone.
📈 Summary / Interpretation:
Current Bias: Bearish in the short term.
Why: Price was rejected at a resistance zone, broke below the support trendline, and is now heading down.
Target: Around $3,366, aligned with previous support and the 200 EMA.
Potential Reaction Zone: Watch the blue zone for a bounce or further breakdown.
💡 Trading Insight:
Bearish Setup: Short opportunities may be valid below the broken trendline, targeting $3,366.
Invalidation: If price climbs back above $3,428 (near resistance), the bearish view may be invalid.
Would you like an updated outlook based on live price data or a longer-term forecast too?
Trade closed: target reached
Target at the support zone around 3,373 was successfully hit after price rejected from resistance near 3,450 and followed a downward trend. Trade played out as expected, respecting both resistance and trendline structures.Note
Setup: Price formed a double top near the resistance zone (~3,450) and respected the descending trendline.Entry: Initiated short position after bearish rejection with confirmation from Supertrend and EMA alignment.
Target: Support zone around 3,373 marked as target.
Result: Target successfully achieved as price followed bearish structure.
Key Levels:
Resistance: ~3,450
Target/Support: ~3,373
Tools Used: EMA 20/50/100/200, Supertrend, Trendlines, Price Action
Conclusion: Well-executed short trade respecting technical structure and confirmation signals.
Disclaimer
The information and publications are not meant to be, and do not constitute, financial, investment, trading, or other types of advice or recommendations supplied or endorsed by TradingView. Read more in the Terms of Use.
Disclaimer
The information and publications are not meant to be, and do not constitute, financial, investment, trading, or other types of advice or recommendations supplied or endorsed by TradingView. Read more in the Terms of Use.