The Middle East situation has been as tense as a taut bowstring recently, with conflicts between Israel and Iran escalating continuously. Iran's Supreme Leader Ayatollah Khamenei has made a tough stance, vowing to militarily destroy the Israeli regime, while the Israeli military has detected multiple rounds of missile attacks from Iran. Donald Trump's call for all to evacuate Tehran has instantly heightened market concerns about an escalation of U.S.-Iran tensions. Gold, long regarded by investors as a "safe haven," has seen its appeal surge significantly amid such geopolitical turmoil. A massive influx of investors pouring into the gold market for capital safety—like adding weights to one side of a balance—has driven gold prices higher.
However, it's crucial to note that while the situation remains tense, market reactions to the conflict are gradually shifting. On one hand, the market has partially digested the impact of the conflict, with sentiment no longer as excessively panicked as at the outset. On the other hand, the market is monitoring potential for de-escalation. If news emerges about possible negotiations between the parties or if the conflict does not expand further, risk-aversion sentiment may cool, weakening support for gold prices. For instance, when Iran previously signaled a potential resumption of nuclear talks, gold prices experienced profit-taking. Thus, as long as the Middle East situation does not show substantial easing, gold prices are likely to remain relatively high supported by safe-haven demand, though volatility may become more complex.
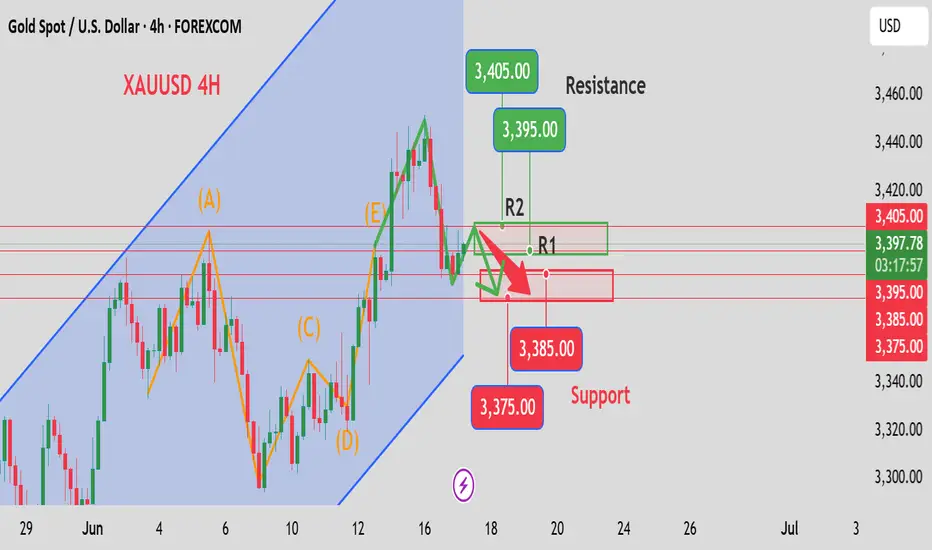
From a technical chart perspective, gold prices recently broke through the key resistance level of $3,400 and are now at $3,395. This indicates that bullish forces have dominated recently, pushing prices higher. However, as prices continue to rise, some technical indicators are starting to send mixed signals. In terms of K-line patterns, while the bodies of bullish candles have grown recently, their upper shadows have lengthened, suggesting that bearish forces are strengthening and beginning to contest with bulls at high levels, intensifying the tug-of-war between the two sides. The moving average system currently shows a bullish arrangement, with short-term averages crossing above long-term ones to form a golden cross—a positive signal for an upward trend. Nevertheless, the current price deviates significantly from the moving averages. According to conventional technical analysis logic, prices may need a correction to realign with the averages and rationalize technical indicators, adding complexity and uncertainty to future price movements.
On the daily chart, gold is trading within an upward channel formed by two bottom lows ($3,245 and $3,293) and two top highs ($3,382 and $3,452). The current price is constrained by the channel's upper trendline, which also hinders further upside. From a 4-hour perspective, Bollinger Bands are narrowing, indicating the market is consolidating and may soon choose a new direction. If prices can hold above $3,380, the upward trend may continue; conversely, a break below $3,380 could trigger a retest of the lower band for support.
Today's gold trading strategy, I hope it will be helpful to you
XAUUSD sell@3405~3395
SL:3420
TP:3385~3375
However, it's crucial to note that while the situation remains tense, market reactions to the conflict are gradually shifting. On one hand, the market has partially digested the impact of the conflict, with sentiment no longer as excessively panicked as at the outset. On the other hand, the market is monitoring potential for de-escalation. If news emerges about possible negotiations between the parties or if the conflict does not expand further, risk-aversion sentiment may cool, weakening support for gold prices. For instance, when Iran previously signaled a potential resumption of nuclear talks, gold prices experienced profit-taking. Thus, as long as the Middle East situation does not show substantial easing, gold prices are likely to remain relatively high supported by safe-haven demand, though volatility may become more complex.
From a technical chart perspective, gold prices recently broke through the key resistance level of $3,400 and are now at $3,395. This indicates that bullish forces have dominated recently, pushing prices higher. However, as prices continue to rise, some technical indicators are starting to send mixed signals. In terms of K-line patterns, while the bodies of bullish candles have grown recently, their upper shadows have lengthened, suggesting that bearish forces are strengthening and beginning to contest with bulls at high levels, intensifying the tug-of-war between the two sides. The moving average system currently shows a bullish arrangement, with short-term averages crossing above long-term ones to form a golden cross—a positive signal for an upward trend. Nevertheless, the current price deviates significantly from the moving averages. According to conventional technical analysis logic, prices may need a correction to realign with the averages and rationalize technical indicators, adding complexity and uncertainty to future price movements.
On the daily chart, gold is trading within an upward channel formed by two bottom lows ($3,245 and $3,293) and two top highs ($3,382 and $3,452). The current price is constrained by the channel's upper trendline, which also hinders further upside. From a 4-hour perspective, Bollinger Bands are narrowing, indicating the market is consolidating and may soon choose a new direction. If prices can hold above $3,380, the upward trend may continue; conversely, a break below $3,380 could trigger a retest of the lower band for support.
Today's gold trading strategy, I hope it will be helpful to you
XAUUSD sell@3405~3395
SL:3420
TP:3385~3375
Disclaimer
The information and publications are not meant to be, and do not constitute, financial, investment, trading, or other types of advice or recommendations supplied or endorsed by TradingView. Read more in the Terms of Use.
Disclaimer
The information and publications are not meant to be, and do not constitute, financial, investment, trading, or other types of advice or recommendations supplied or endorsed by TradingView. Read more in the Terms of Use.