XAUUSD 4H Chart Analysis Summary:
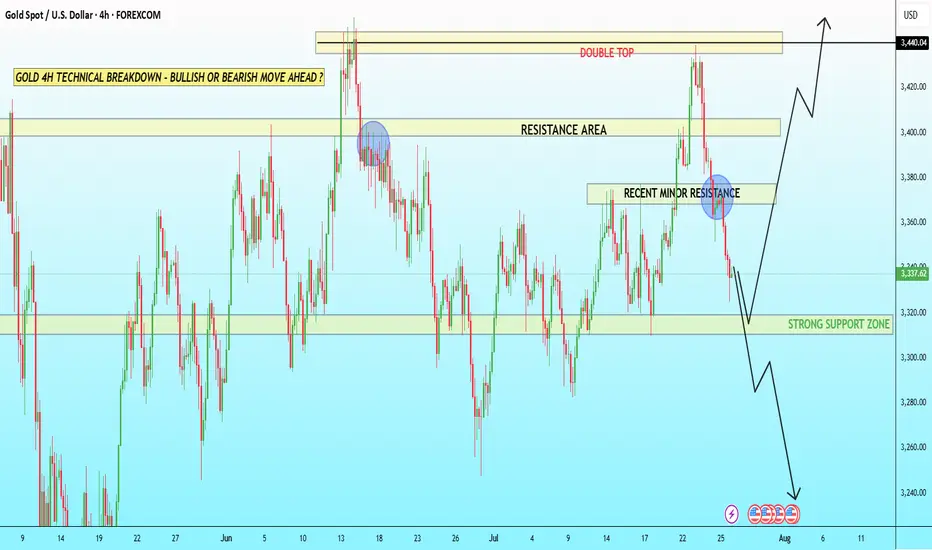
The chart indicates a key technical setup with potential bullish and bearish scenarios based on price reaction at support and resistance zones.
🔍 Key Levels Identified:
Double Top Formation: Around 3440, a strong reversal pattern indicating possible selling pressure.
Resistance Area: Between 3380 – 3440, multiple rejections suggest strong supply.
Recent Minor Resistance: Near 3360, where price failed to hold after testing.
Strong Support Zone: Around 3280 – 3310, price may bounce from here.
📉 Bearish Scenario:
If price breaks below the strong support zone (3280):
Possible downside continuation.
Target 1 (TP1): 3250
Target 2 (TP2): 3220
Stop Loss (SL): Above 3360 (recent resistance)
📈 Bullish Scenario:
If price bounces from the strong support zone:
Look for a reversal with confirmation (bullish engulfing, double bottom).
Target 1 (TP1): 3360 (minor resistance)
Target 2 (TP2): 3380 – 3400 (major resistance)
Target 3 (TP3): 3440 (double top zone)
Stop Loss (SL): Below 3280
📝 Suggested Title:
“XAUUSD 4H Technical Setup – Double Top & Key Support Bounce Potential”
Let me know if you want updated levels or trade ideas based on live prices.
JOIN MY TELEGRAM:
FREE SIGNALS TECHNICAL CHART AND EDUCATOIN
t.me/+j_sv6p9sL5I0MDY0
FREE SIGNALS TECHNICAL CHART AND EDUCATOIN
t.me/+j_sv6p9sL5I0MDY0
Disclaimer
The information and publications are not meant to be, and do not constitute, financial, investment, trading, or other types of advice or recommendations supplied or endorsed by TradingView. Read more in the Terms of Use.