Analysis of gold news
Risk aversion is heating up:
US President Trump announced that he would impose a 30% tariff on EU imports from August 1, and threatened to take similar measures against Mexico, exacerbating global trade tensions and driving gold safe-haven buying.
The market is worried that the escalation of the trade war may drag down global economic growth, prompting funds to flow into safe-haven assets such as gold.
Federal Reserve policy expectations:
Although the market's expectations for the Fed's rate cuts have cooled (the probability of keeping the policy unchanged in July is 93.3%), if the June CPI data exceeds expectations (released on Tuesday), it may further weaken the expectation of rate cuts, which is bearish for gold in the short term.
If inflation data is lower than expected, or Trump's tariff policy triggers broader economic concerns, gold may regain momentum.
Geopolitical risks:
Trump plans to make a "major statement" on the Russian issue, which may further support gold prices if it involves new sanctions or escalating tensions.
Technical analysis of gold
Short-term trend:
Bulls are dominant. After gold price breaks through the key resistance of 3355-3360, the short-term target is 3375-3390 (June high).
If it breaks through 3375, the next target is 3420 (downward trend line resistance), and even challenges the previous high of 3450.
Key support and resistance:
Support level:
3330-3325 (daily trend lifeline, if it falls below, it will turn weak).
3300 (psychological barrier, if it falls, it may fall to 3245-3200).
Resistance level:
3375-3380 (European high, if it breaks through, it will look at 3400).
3420 (April downtrend line, a breakout would confirm a bigger uptrend).
Trading strategy:
Main strategy (low-level long):
Go long at 3330-3335, stop loss at 3325, target 3360-3375.
If the US market stabilizes at 3375, you can go long again after falling back to 3365, with a target of 3400.
Alternative strategy (short at high):
Short when it rebounds to 3370-3375, stop loss at 3380, target 3345-3330 (only for intraday correction).
Today's focus
Economic data:
US June CPI (released on Tuesday, affecting Fed policy expectations).
PPI, retail sales data (Wednesday to Thursday).
Geopolitics:
Trump's statement on Russia (if it involves new sanctions, it may boost gold).
Market sentiment:
If risk aversion demand continues, gold may remain volatile at a high level; if risk appetite picks up (such as a stock market rebound), gold prices may be under pressure.
Summary
Short-term trend: bullish, pay attention to the breakthrough of the 3330-3375 range.
Operation suggestions:
Low-to-long mainly (3330-3335 support zone), stop loss 3325, target 3360-3375.
High-to-short as auxiliary (3370-3375 resistance zone), stop loss 3380, target 3345.
Risk warning:
CPI data may cause violent fluctuations, and short-term correction risks should be alerted.
If it falls below 3330, it may weaken to the support zone of 3300-3285.
Trade active
Analysis of the latest gold market trends and trading strategies on July 15:
1. Current market dynamics
Yesterday's trend: Affected by Trump's tariffs on the EU, gold rose to 3374.78 (a three-week high) on Monday and then fell back, showing a "roller coaster" trend.
Key influencing factors:
Positive factors:
Geopolitical risks (US-Russia tensions, Trump's 30% tariff on the EU).
Federal Reserve rate cut expectations (the market expects a 60% probability of a rate cut in September).
Negative factors:
The dollar strengthened (the US dollar index fluctuated at a high level).
Rising US Treasury yields (suppressing interest-free assets such as gold).
If the CPI data exceeds expectations (it may strengthen expectations of high interest rates).
2. Key technical analysis
1. Daily level
Trend: Under pressure in the short term, but still above 3330 (key support).
Bollinger Bands: If the upper track (3380) cannot be broken, the adjustment may continue.
Moving average support: 3340-3345 (50-day moving average + Bollinger middle rail), if it falls below, it will look to 3325-3330 (55-day moving average).
2. 4-hour level
Key support:
3340-3345 (short-term support).
3325-3330 (the last line of defense for bulls, if it falls below, the trend will weaken).
Key resistance:
3370-3375 (yesterday's high).
3385 (may challenge 3400 after breaking through).
3. Today's trading strategy (before CPI data)
1. Short-term operation ideas
Main strategy: long on pullback (relying on 3340-3350 support).
Auxiliary strategy: short on rebound (when 3375-3380 is blocked).
2. Trading plan for key points
Pre-CPI shock, long position near 3350, stop loss below 3340, target 3365-3370
Break through 3375, go long after stepping back to 3365, stop loss 3355, target 3380-3385
Break below 3340, short short, stop loss 3350, target 3330-3325
3. Strategy adjustment after CPI data
If CPI is lower than expected (bullish for gold):
Break through 3380 to increase long position, target 3400.
If CPI is higher than expected (bearish for gold):
Go short after falling below 3340, target 3325-3300.
IV. Risk Warning
CPI data fluctuation risk: CPI data may fluctuate violently within 5 minutes after the data is released. It is recommended to place orders or wait for trend confirmation.
Geopolitical emergencies: If the conflict between the United States and Russia escalates, gold may quickly break through 3380, and positions need to be adjusted in time.
Strict stop loss: single stop loss ≤ 1.5% of position, move stop loss to cost price after profit exceeds 2%.
5. Key events to watch: US June CPI data.
Speech by Federal Reserve officials (may affect market expectations)
Trade closed: target reached
The latest gold trend analysis strategy on July 16:
1. Interpretation of gold news (fundamental analysis):
Trump's tariff increase news stimulates risk aversion:
Trump announced that tariffs would be imposed on the European Union from August 1, triggering a surge in market risk aversion, which helped push gold prices to $3,374.78/ounce, a three-week high.
Intertwined long and short factors:
Positive factors:
Rising geopolitical risks (US-EU trade frictions)
Inflation fell (core CPI and CPI slightly lower than expected)
Increased uncertainty in the Fed's policies
Negative factors:
Stronger US dollar index
U.S. bond yields rose
Inflation data has limited support for gold prices:
Although inflation data is lower than expected, the market reacted cautiously to the Fed's expectations of a rate cut, causing gold prices to fluctuate and fall from a high level.
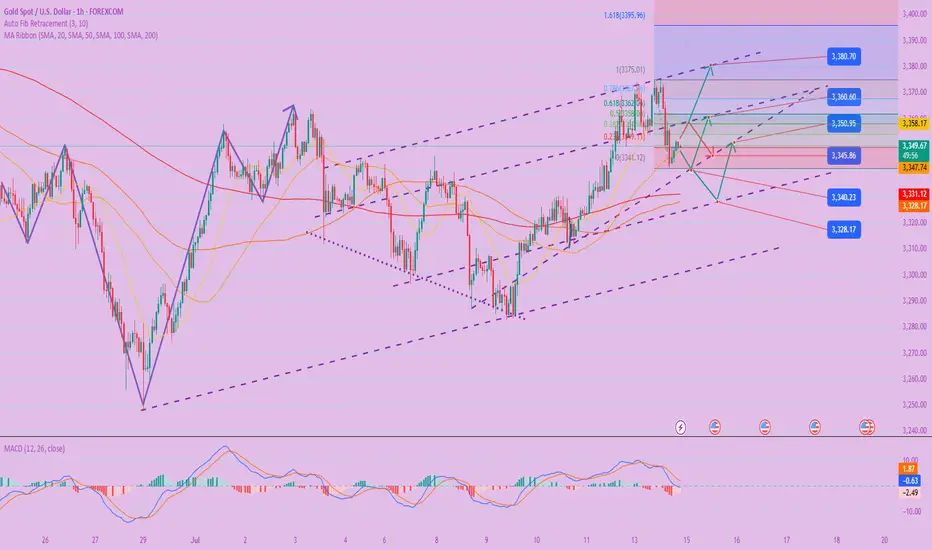
2. Technical analysis of gold:
Daily structure:
Key support: 3330 USD/oz (if not broken, the rising structure will remain)
Resistance position: 3360-3370 USD/oz
Currently, it is still above the short-term moving average of 3330, with a bullish trend, but it will fall back when under pressure.
4-hour level:
Strong support area: 3325-3330 (if it falls below, the short-term trend will weaken)
If the range is maintained, there is still room for a short-term rebound
Bull defense line: 3325, if it falls below, it will look down to 3310 or even 3300
Short-term key signals:
If the price cannot stand on the upper track of the Bollinger band (around 3370), it will be difficult to continue to attack in the short term
If the low point falls below 3340, it may indicate that the signs of weakening are strengthening
III. Operation suggestions (for reference only):
✅ Today's gold operation ideas:
Main idea: mainly long on pullbacks, and short on rebounds
🔽 Long order strategy:
Entry point: long in batches near 3325-3330
Stop loss reference: below 3318
Target: 3355-3365, aggressive ones can look at 3370
🔼 Short order strategy:
Entry point: 3365-3370 Light short position in the resistance area
Stop loss reference: 3378 above
Target: 3340-3330
IV. Risk warning:
Pay close attention to the speeches of Fed officials and the latest geopolitical developments
If the US dollar index strengthens further, it will limit the rebound space of gold
❤️Free gold trading signals:t.me/+7W6lfjoqQ-Y2NjU0
🥇Gold price trend analysis and forecast
💹Technical analysis (K-line patterns, trend lines, indicator systems)
✅Gold's safe-haven properties and asset allocation strategy
🥇Gold price trend analysis and forecast
💹Technical analysis (K-line patterns, trend lines, indicator systems)
✅Gold's safe-haven properties and asset allocation strategy
Related publications
Disclaimer
The information and publications are not meant to be, and do not constitute, financial, investment, trading, or other types of advice or recommendations supplied or endorsed by TradingView. Read more in the Terms of Use.