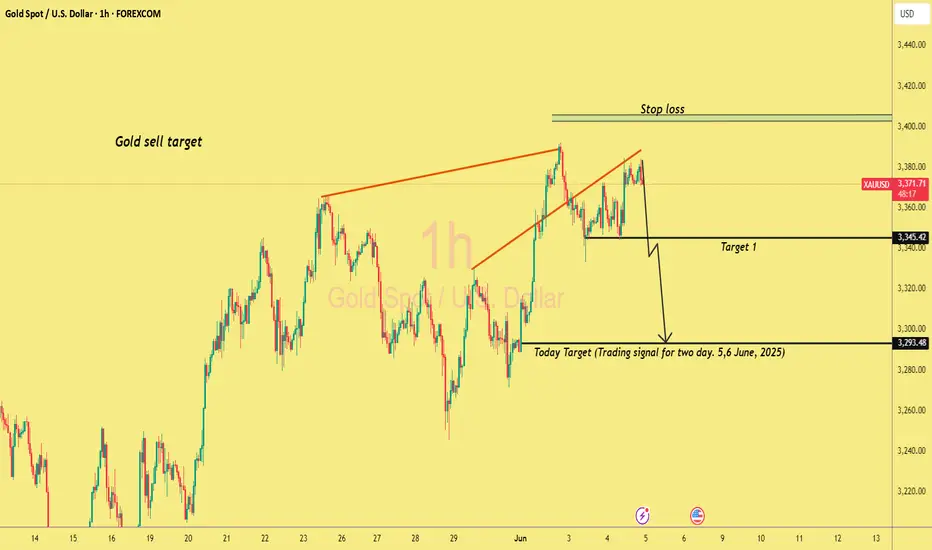
I'm provided a chart with a downward trend, indicating a potential sell signal for gold. The chart is labeled "Gold sell target" and has a "Stop loss" line above it. The "Today Target (Trading signal for two day, 5,6 June, 2025)" is also indicated on the chart.
To determine the take profit (TP) levels for a gold sell trade, we need to analyse the chart and identify potential support levels. Based on the chart, the current price is around 3,373.36 USD, and the target price is around 3,293.48 USD.
Assuming the trade is a sell trade, the take profit levels could be set at the following prices:
- TP1: 3,342.00 USD (a potential support level)
- TP2: 3,310.00 USD (another potential support level)
- TP3: 3,293.00 USD (indicated target setup in the chart)
Stop loss: around 33410
However, without more information about the trading strategy and risk management, it's difficult to provide a more specific answer.
Based on the chart, a possible take profit level for a gold sell trade could be around 3,293.48 USD, which is the "Today Target" indicated on the chart.
Trade active
Target 1 hit running in 430Disclaimer
The information and publications are not meant to be, and do not constitute, financial, investment, trading, or other types of advice or recommendations supplied or endorsed by TradingView. Read more in the Terms of Use.
Disclaimer
The information and publications are not meant to be, and do not constitute, financial, investment, trading, or other types of advice or recommendations supplied or endorsed by TradingView. Read more in the Terms of Use.
