1. Interpretation of gold news (fundamental analysis):
Trump's tariff increase news stimulates risk aversion:
Trump announced that tariffs would be imposed on the European Union from August 1, triggering a surge in market risk aversion, which helped push gold prices to $3,374.78/ounce, a three-week high.
Intertwined long and short factors:
Positive factors:
Rising geopolitical risks (US-EU trade frictions)
Inflation fell (core CPI and CPI slightly lower than expected)
Increased uncertainty in the Fed's policies
Negative factors:
Stronger US dollar index
U.S. bond yields rose
Inflation data has limited support for gold prices:
Although inflation data is lower than expected, the market reacted cautiously to the Fed's expectations of a rate cut, causing gold prices to fluctuate and fall from a high level.
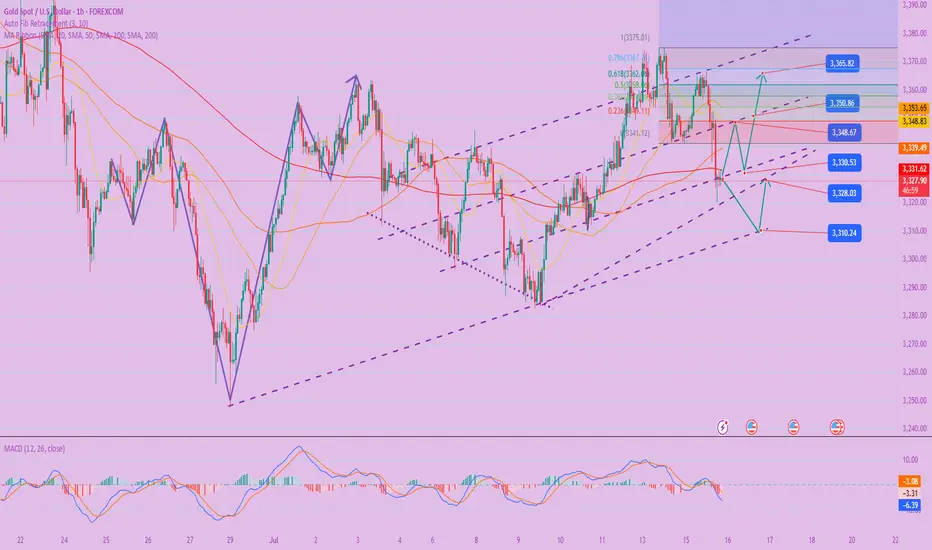
2. Technical analysis of gold:
Daily structure:
Key support: 3330 USD/oz (if not broken, the rising structure will remain)
Resistance position: 3360-3370 USD/oz
Currently, it is still above the short-term moving average of 3330, with a bullish trend, but it will fall back when under pressure.
4-hour level:
Strong support area: 3325-3330 (if it falls below, the short-term trend will weaken)
If the range is maintained, there is still room for a short-term rebound
Bull defense line: 3325, if it falls below, it will look down to 3310 or even 3300
Short-term key signals:
If the price cannot stand on the upper track of the Bollinger band (around 3370), it will be difficult to continue to attack in the short term
If the low point falls below 3340, it may indicate that the signs of weakening are strengthening
III. Operation suggestions (for reference only):
✅ Today's gold operation ideas:
Main idea: mainly long on pullbacks, and short on rebounds
🔽 Long order strategy:
Entry point: long in batches near 3325-3330
Stop loss reference: below 3318
Target: 3355-3365, aggressive ones can look at 3370
🔼 Short order strategy:
Entry point: 3365-3370 Light short position in the resistance area
Stop loss reference: 3378 above
Target: 3340-3330
IV. Risk warning:
Pay close attention to the speeches of Fed officials and the latest geopolitical developments
If the US dollar index strengthens further, it will limit the rebound space of gold
Trade active
Analysis of the latest gold market trends and trading strategies:
1. Analysis of gold news
Risk aversion supports gold prices:
Trump plans to impose tariffs on some countries (tax rates may exceed 10%), and the market is worried about the escalation of trade frictions, and gold has received certain safe-haven buying.
But the strengthening of the US dollar (the US dollar index rose to 98.7, a three-week high) limited the rise in gold prices.
Inflation data suppressed gold:
The US CPI in June recorded the largest increase since January, reinforcing the Fed's expectations of maintaining high interest rates. US Treasury yields rose to a six-week high, and gold was under pressure.
Market sentiment remains volatile:
Despite the short-term decline in gold prices, the market is not completely bearish as trade policy uncertainty may provide support in the future.
2. Technical analysis of gold
1. Daily level
Key points:
Resistance: 3365 (yesterday's high), 3375 (recent oscillation upper track)
Support: 3320 (short-term low), 3315-3310 (key psychological level)
Form:
Yesterday's closing of a long shadow line shows that the upper selling pressure is strong, and there is still a downside risk in the short term.
If the 3310-3320 support can be maintained, it may maintain volatility; if it falls below 3300, it may further correct.
2. 4-hour level
Oscillating range: 3310-3375 (recent wide range of fluctuations)
Short-term trend:
Yesterday fell below the middle track (near 3340), short-term bearish, but the lower track (near 3320) provides support.
If it rebounds to the 3355-3365 area, it can be regarded as a new short-selling opportunity.
3. Today's gold trading strategy
1. Main strategy: short on rebound
Entry point: 3355-3365 (4-hour middle track resistance zone)
Stop loss: above 3375 (wait and see if it breaks through)
Target: 3320→3310 (see 3300 if it falls below)
Logic:
The dollar is strong + the technical side is under pressure, and you can try short orders when it rebounds to the key resistance level.
2. Auxiliary strategy: short-term long on pullback (cautious operation)
Entry point: 3320-3325 (short-term support)
Stop loss: below 3310 (give up if it breaks through)
Target: 3340-3350 (quick in and quick out)
Logic:
If the gold price stabilizes around 3320, it may rebound in the short term, but strict stop loss is required.
4. Key risk reminder
Dollar trend: If the US dollar continues to strengthen (break through 99), gold may be further under pressure.
Changes in trade policy: If Trump's tariff policy is implemented, market risk aversion may rise, supporting gold prices.
Technical breakthrough: If the gold price breaks through 3375, it may return to a volatile upward trend and need to adjust its strategy.
5. Summary
Short-term trend: Oscillating and bearish, but it is not advisable to over-pursue before breaking the key support.
Operation suggestions:
Conservative: Wait for 3355-3365 to short, stop loss 3375, target 3320-3310.
Aggressive: Try long with a light position near 3320, stop loss 3310, target 3340-3350.
Key points:
Upper resistance: 3355→3365→3375
Lower support: 3320→3310→3300
❤️Free gold trading signals:t.me/+7W6lfjoqQ-Y2NjU0
🥇Gold price trend analysis and forecast
💹Technical analysis (K-line patterns, trend lines, indicator systems)
✅Gold's safe-haven properties and asset allocation strategy
🥇Gold price trend analysis and forecast
💹Technical analysis (K-line patterns, trend lines, indicator systems)
✅Gold's safe-haven properties and asset allocation strategy
Related publications
Disclaimer
The information and publications are not meant to be, and do not constitute, financial, investment, trading, or other types of advice or recommendations supplied or endorsed by TradingView. Read more in the Terms of Use.