2025/02/08 - 6th Calendar Week
Daily 4XSetUps - Bulls Seem To Be Running Out Of Steam In YM1!
“100 sma served as a bullish trend reversal at the start of this year!
is there enough bull power for another even higher all-time high?”
The US stock markets ended the weekend weakly. Looking back, there were a few triggers - at the opening yesterday, Friday, February 7th, 2025, I thought that we would say goodbye to the weekend in a relaxed manner as far as the price action was concerned! But I thought wrong? It is likely that US President Donald Trump's statements about tariffs moved the price action. In addition, the labor market continued to be robust in January 2025, which evaporated hopes of an early interest rate cut by the FED. "The US unemployment rate dipped by 0.1 percentage point to 4.0% in January 2025, marking its lowest level since May and coming in just below market expectations of 4.1%. The number of unemployed individuals declined by 37,000 to 6.85 million, while employment edged up by 2,234 to 163.9 million." Because the unemployment rate fell - while fewer new jobs were created than expected. "The US economy added 143K jobs in January 2025, well below an upwardly revised 307K gain in December and forecasts of 170K. Job gains occurred in health care (44K), retail trade (34K), and social assistance (22K) and government employment continued to trend up (32K)." And depending on this, the online retail giant Amazon
Lance Roberts of Real Investment Advice published a worthwhile article on Friday regarding the Fed. "The Federal Reserve's record of forecasting has frequently led it to respond too late to changes in economic and financial conditions. In the most recent FOMC meeting, the Federal Reserve changed its statement to support a pause in the current interest rate-cutting cycle." Read it - it's worth it, even if I don't agree with him on everything. But you don't have to. Because after reading you know more than before.
“Look for people who have lots of great questions. Smart people are the ones who ask the most thoughtful questions, as opposed to thinking they have all the answers. Great questions are a much better indicator of future success than great answers.”
Ray Dalio
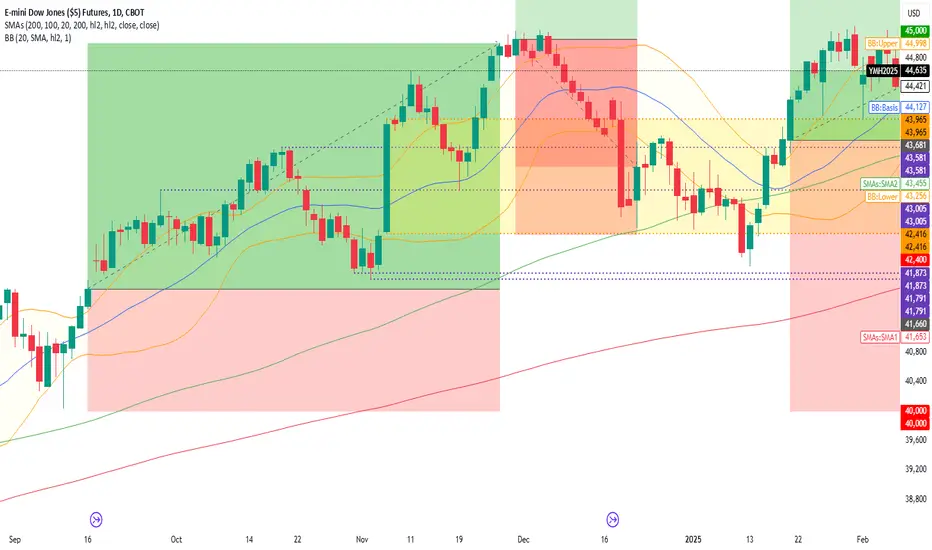
44998 : 2025/02/07 - BB Upper 020 hl/2
44421 : 2025/02/07 - last price action
44127 : 2025/02/07 - BB Basis 020 hl/2
43256 : 2025/02/07 - BB Lower 020 hl/2
43455 : 2025/02/07 - 100 SMA hl/2
41653 : 2025/02/07 - 200 SMA hl/2
The fact that the 200 SMA stands at 41653 points at the weekend is reassuring - as there is enough buffer above the 40000 point mark - which should be an important psychological stabilization factor. The 100 SMA is even more important because the price action is closer to it - at 43455 points at the weekend. Which, with a closing price of 44421 points, is just under 1000 points. Sure - a shock wave from Trump? Traders and/or investors send the price action up or down 1000 points in one day - no problem! But today we will only stay in the context of technical indicators. And at the 100 SMA. Because the 100 SMA showed us in retrospect both in August 2024 and/or in January 2025 (so far at least) that the price action below it - on the relevant 4 and/or 5 trading days - were buying opportunities. So I expect a further rise in
-----------------------------------------------
50000 : 2025/12/30 - Target Price
-----------------------------------------------
44421 : 2025/02/07 - last price action
43681 : 2025/01/21 - Entry Price
-----------------------------------------------
40000 - 2025/06/30 - Stop Price
-----------------------------------------------
Have a good time
- regardless of the price action!
Aaron
“daily 4XSetUps - …” is pure information material!
By trying to give you even more information about some trading capabilities to trade and/or invest in some securities. This post is not a call to action - it only provides information. You decide (not) to decide. Even if I am writing daily 4XSetUps with concrete entry prices, target prices and/or also stop prices! It is like it is - like I said; You decide to respond to the analysis I just formulated to buy, to sell, or to do nothing! More information about my approaches to investing in something specific or just trading it, or even just describing it, can be found in the daily "Another 48h - DXY ...! Analysis Post. Where I try to track the price action in
Related publications
Disclaimer
The information and publications are not meant to be, and do not constitute, financial, investment, trading, or other types of advice or recommendations supplied or endorsed by TradingView. Read more in the Terms of Use.
Related publications
Disclaimer
The information and publications are not meant to be, and do not constitute, financial, investment, trading, or other types of advice or recommendations supplied or endorsed by TradingView. Read more in the Terms of Use.