Vanguard - “We are the invisible hand of Adam Smith” John BogleIf anyone ever thought of erecting a monument to the person who did the most for American investors — the choice would fall on John Bogle. These words are not from a promotional brochure but a quote from Warren Buffett himself.
Book summary
But most people don’t even know who Bogle is. And certainly don’t realize that he didn’t just “create index funds.” He built an invulnerable power machine disguised as client care.
📈 From a thesis to $10 trillion under management
Bogle’s story begins with an ordinary guy born during the Great Depression. Through poverty, scholarship-based education, and working from age 10 — he makes his way into Princeton, where he writes a thesis on a topic that would change the industry: "mutual funds."
Over the years, his philosophy turned into what we now know as "passive investing." From day one, the Vanguard he created operated on the principle: "maximum benefit to the investor, minimum — to the managers." No fees, no speculation, no marketing. And it worked. But here’s the paradox: ▶ Vanguard gave up profit for the mission.
▶ The world responded — investors were tired of the noise.
▶ As a result — "Vanguard grew into a monster capable of managing the economies of entire nations."
🧠 A revolutionary idea: a fund owned by investors
Bogle built a structure where "the fund owners are the investors themselves."
Sounds beautiful: no shareholders, no profit pressure — only long-term client interests. But then who de facto manages these trillions?
⚠️ Vanguard is not a public company.
⚠️ Its shares are not traded.
⚠️ The real ownership mechanism — a black box.
It’s the perfect system for... "invisible control." And this isn’t a conspiracy theory, but logic:
If you can’t find the ultimate beneficiary — it means they’re either too big, or hiding for a reason.
🕸️ The “Big Three” and the invisible hand effect
Vanguard, BlackRock, and State Street — three funds that hold between 3% to 8% of shares in most of the world’s largest corporations. It seems small, but only 15–20% of shares are in free float.
❗ This gives the Big Three “real power”: from voting at meetings to influencing media narratives and climate policy.
📌 They own stakes in CNN, Fox, and Disney.
📌 Invest in oil companies that violate human rights.
📌 And at the same time — push the “green transition” agenda.
Conflict of interest? No. It’s “total control over both sides of the conflict.”
🤫 Why Vanguard is impossible to destroy
If you think Vanguard is just an investment fund, here are a few facts:
🔒 No company shares → can’t buy a controlling stake.
🔒 Over 400 legal entities → can’t file a single lawsuit.
🔒 Every investor essentially becomes a “co-owner” → responsibility is blurred.
🔒 All stakes split below 10% → bypass antitrust laws.
You can’t sue a ghost.
You can’t attack a network if you don’t know where its center is.
🧭 What’s next?
Today, Vanguard manages over $10 trillion, which is more than the GDP of Germany, India, and Brazil combined.
Though the fund’s founder passed away as “the conscience of Wall Street,” his creation became an "architecture of global control" that even the U.S. Federal Reserve couldn’t handle.
🎤 “We are the invisible hand of Adam Smith,” John Bogle once said.
A more detailed book review will follow below. I understand how important this is in our time and I appreciate it.
📘 General Concept of the Book:
The book is at once the autobiography of John Bogle, the story of the founding and development of Vanguard, and a manifesto of index investing philosophy. A runaway waiter, Princeton graduate, and "Wall Street rebel," Bogle creates Vanguard — a company that changed the investment world by making it more fair and accessible.
📑 Structure of the Book:
The book is divided into four parts:
Part I — The History of Vanguard.
Part II — The Evolution of Key Funds.
Part III — The Future of Investment Management.
Part IV — Personal Reflections, Philosophy, and Values of the Author.
💡 Key Ideas of the Book (Introductory Chapters, Preface):
- Index investing is the most important financial innovation of the 20th century.
- Passive management beats active managers in returns and costs.
- Vanguard’s mission is not to make money off investors, but to serve them.
- Criticism of Wall Street: high fees, conflicts of interest, short-term thinking.
- Financial revolution — a mass shift of investors from active to index funds.
🧠 Bogle's Values:
- Long-term thinking. Don’t give in to market “noise.”
- Honesty and transparency in investing.
- Minimal costs = maximum return for the investor.
- Fiduciary duty: protecting the client’s interest comes first.
📗 Part I: The History of Vanguard
🔹 Chapter 1: 1974 — The Prophecy
Context:
John Bogle is in a difficult position — he’s fired as head of Wellington Management Company.
During a trip to Los Angeles, he meets John Lovelace of American Funds, who warns: if you create a truly mutual investment company, you’ll destroy the industry.
Main Idea:
⚡ Bogle decides to go against the profit-driven industry and creates Vanguard — a company owned by investors, not managers.
Key Moments:
- Vanguard is founded in 1974 — in the middle of a crisis.
- The company has no external shareholders — all “profits” are returned to investors through lower fees.
- In 1975, the first index fund for individual investors is launched — a revolutionary idea, initially ridiculed as “Bogle’s madness.”
Important Quotes:
"Gross return before costs is market return. Net return after costs is lower. Therefore, to get the maximum, you must minimize costs."
– Bogle’s fundamental rule
🔹 Chapter 2: 1945–1965 — Background: Blair Academy, Princeton, Fortune, and Wellington
Early Life:
Bogle studies at Blair Academy on a scholarship, works as a waiter.
He enters Princeton. Struggles with his economics course, but…
In the library, he accidentally finds the Fortune article “Big Money in Boston” — about mutual funds.
Turning Point:
This article inspires Bogle to write his thesis:
“The Economic Role of the Investment Company”, where he argues:
- Funds should work for investors;
- Don’t expect them to beat the market;
- Costs must be minimized;
- Fund structure must be fair and transparent.
Career Start:
Work at Wellington Management (Philadelphia).
Starts from scratch, rising from junior analyst to president of the company.
Under Walter Morgan’s leadership, he learns the principles of discipline and serving investors.
✍️ Interim Summary
What’s important from these early chapters:
- Vanguard was born from the ruins of Bogle’s former career — an example of how failure can be the beginning of greatness.
- Already in college, Bogle saw the issue of conflicts of interest in the industry.
- His philosophy is idealism in action: don’t play guessing games — just invest in the market and reduce costs.
📘 Chapter 3: 1965–1974 — Rise and Fall
🚀 Appointed President of Wellington Management:
In 1965, at just 35 years old, John Bogle becomes president of Wellington.
He decides to modernize the business and bring in young star managers from Wall Street, especially from the firm Thorndike, Doran, Paine & Lewis.
⚠️ Risky Alliance:
Bogle makes a fatal mistake — he merges with the new management company without ensuring value alignment.
The new partners are focused on profit and short-term gains, not building a strong long-term foundation.
This leads to internal conflict, loss of trust, and poor fund performance.
💥 Dismissal:
In 1974, after a series of conflicts, the board removes Bogle.
He loses control of the company he built for nearly 25 years.
Bogle’s comment:
"I was fired, but I was still chairman of the Wellington mutual funds — and that turned out to be a lifeline."
📘 Chapter 4: 1974–1975 — The Birth of Vanguard
🧩 A Unique Legal Loophole:
Though Bogle was fired from the management company, he remained head of the Wellington Fund trustees — giving him the opportunity to build a new independent structure.
🛠 Creating Vanguard:
In December 1974, he launches The Vanguard Group — a company owned by the investors (shareholders) themselves.
Model: the fund belongs to the investors → the fund owns the management company → no outside profit, only cost recovery.
⚙️ "Vanguard" as a Symbol:
The name was inspired by Admiral Horatio Nelson’s ship — HMS Vanguard.
A symbol of leadership, courage, and moving against the tide.
Key Idea:
Vanguard would be the only truly mutual investment organization — a model where clients = owners.
📘 Chapter 5: 1975 — The First Index Fund
🤯 Revolution: The Indexing Approach
Bogle decides to create the first index mutual fund for retail investors.
Name: First Index Investment Trust (later — Vanguard 500 Index Fund).
Idea: invest in all S&P 500 stocks to reflect the market’s return instead of trying to beat it.
🪓 A Blow to the Industry:
The financial world reacts harshly:
- “Bogle’s madness”;
- “This is a failure”;
- “Who would want to just match the market?”
🔧 Humble Beginning:
The goal was to raise $150 million, but only $11 million was collected — tiny by industry standards.
But Bogle didn’t give up:
"It was a small step, but with a powerful message."
💡 Summary of Chapters 3–5: How Vanguard Was Built
🔑 Event 💬 Meaning
Loss of control at Wellington ----- Collapse of the old model, beginning of a new path
Creation of Vanguard------------- Innovative, investor-first structure
Launch of index fund--------------Start of the indexing revolution, Bogle’s core philosophy
📝 Quotes for Thought:
"All I did was apply common sense. I just said: Let’s leave the returns to the investors, not the managers." — John Bogle
"This is a business where you get what you don’t pay for. Lower costs = better results." — Bogle’s favorite saying, debunking “more is better”
📘 Chapter 6: 1976–1981 — The Survival Period
⏳ Tough Start:
After launching the index fund, Vanguard faces slow growth and constant skepticism.
For 83 straight months (nearly 7 years!), Vanguard sees net outflows — investors are hesitant to trust this new model.
🧱 Laying the Foundation:
Bogle and his team focus on:
- Transparency
- Lowering costs
- Investor education (they explain what it means to “stay the course”)
💬 The Core Dilemma:
"All investors want to beat the market. But no one wants to pay the price: high fees, taxes, risks. We offered an alternative — reliability, simplicity, and low cost."
📈 Small Wins:
Despite modest volume, Vanguard starts building a reputation as an “honest player.”
It becomes evident: investors using Vanguard achieve better long-term results than those chasing trendy funds.
📘 Chapter 7: 1982–1991 — Growth and Recognition
💡 The Power of Philosophy:
Bogle keeps repeating: “Stay the course” — don’t try to predict the market, don’t fall for fear and greed.
This message becomes especially powerful after the 1982 and 1987 market crises.
🏆 The First Fruits:
A slow but steady increase in assets begins.
Vanguard launches new index funds:
- Total Stock Market Index
- Bond Index
- International Index
📣 Educational Mission:
Bogle writes books, articles, gives interviews.
He isn’t just running a fund — he’s changing how people think about investing.
A community of followers emerges — the Bogleheads.
📊 Key Stats:
By 1991, Vanguard's assets reach around $130 billion.
Index funds begin receiving positive reviews from analysts, including Morningstar.
📘 Chapter 8: 1991–1999 — Industry Leadership
🚀 Explosive Growth:
In the 1990s, index funds go mainstream.
Investors realize that most active funds underperform the market — and they vote with their money for Vanguard.
🧰 Expanding the Product Line:
Vanguard introduces:
- Retirement funds
- Bond funds
- International and balanced funds
- Admiral Shares — low-cost funds for loyal investors
📢 Open Fight with the Industry:
Bogle continues to harshly criticize Wall Street:
- For greed, manipulation, and lack of transparency
- For prioritizing company profit over client interest
"The industry hates Vanguard because it proves you can be honest and still succeed."
⚠️ Internal Challenges:
In the late 1990s, Bogle’s health declines.
He passes leadership to Jack Brennan but retains influence on company strategy.
📊 Midpoint Summary (Chapters 6–8)
📅 Phase 📈 Essence
1976–1981 Quiet survival: building the model, fighting for trust
1982–1991 Slow growth: philosophy attracts investors
1991–1999 Recognition and leadership: indexing becomes dominant
💬 Bogle Quotes from These Chapters:
"Investing is not a business. It’s a service. Those who forget this lose everything."
"Every dollar spent on fees is a dollar lost to your future."
"Volatility is not the enemy. The real enemy is you, if you panic."
📘 Chapter 9: Leadership as a Calling
💡 A Leader ≠ A Manager:
Bogle contrasts a true leader with just an efficient executive.
A real leader:
- Puts others’ interests above their own
- Has a moral compass, not just KPIs
- Makes hard, unpopular decisions
🛤 His Leadership Style:
"Don’t ask others to do what you wouldn’t do yourself."
"Always explain why — people follow meaning, not orders."
He genuinely believes Vanguard should be more than a successful business — it should be a force for good in the market.
"Leadership is loyalty to an idea bigger than yourself."
🔄 Feedback Principle:
Bogle constantly interacts with clients, employees, and journalists.
He never isolates himself in an “ivory tower” — he believes this openness is a leader’s true strength.
📘 Chapter 10: Client Service — Vanguard’s Mission
🧭 The Mission:
"Maximize investor returns — not company profits."
Vanguard is built around fiduciary responsibility: every decision must pass the test — is this in the investor’s best interest or not?
🧾 How It’s Implemented:
- Fees below market average → investors keep more
- No ads for “hot” funds → Vanguard sells stability, not trends
- No sales commissions → no one profits off pushing funds to clients
- Ethical code — “Don’t do anything you wouldn’t want on the front page of the newspaper.”
"We’re not trying to be the best for Wall Street. We’re trying to be the best for you."
📘 Chapter 11: The Market Should Serve Society
📉 Critique of Modern Wall Street:
Bogle argues that finance has drifted from its original purpose.
Investing has turned into trading.
The investor became a cash cow, not a partner.
"The market now serves itself — and we’re still paying the price."
🌱 What the System Should Look Like:
- Companies should serve society
- Investors should be owners, not speculators
- Funds should be transparent, accountable, and honest
📢 Call for Reform:
Bogle calls for a rethinking of finance:
- Restore the human element
- Make mission more important than profit
- Protect long-term interests of millions of ordinary investors
"If we want capitalism with a human face, we must return finance to serving society."
📊 Summary of Chapters 9–11: Bogle's Philosophy
📌 Direction------------💬 Essence
Leadership-------------Morality, leading by example, purpose-driven
Business---------------First and foremost — service to the client
Financial System-------Must work for society, not just for profit of the few
✨ Inspirational Quotes:
"The most important thing you can invest is not money — it’s your conscience."
"Honesty in business is not a competitive edge. It’s a duty."
"I’m not against capitalism. I’m against capitalism without morals."
📘 Chapter 12: The Future of Investing — Where the Industry Is Headed
🌐 Bogle sees three main trends:
Victory of Passive Investing:
- Index funds continue to displace active management
- Their share of assets under management is growing rapidly
- More investors are realizing the power of simplicity
Fee Pressure:
- Fees are approaching zero (some funds are effectively free)
- Winners: investors. Losers: traditional management companies
The Role of Technology:
- Rise of robo-advisors (automated investment advisors)
- But Bogle warns: Technology without philosophy is just a tool, not a solution
🚨 Threat #1 — Hyperfinancialization:
"The market is turning into a casino. And the fewer the players, the more the house wins."
Bogle reminds us: the goal of investing is owning businesses — not gambling.
The higher the turnover, the more you lose on fees and taxes.
📘 Chapter 13: The Power of Indexing — Threat or Blessing?
📈 Strength in Scale:
The biggest index providers (Vanguard, BlackRock, State Street) own large shares in nearly all companies in the indexes.
This raises the issue of concentrated power — is too much influence in too few hands?
⚖️ The Indexing Paradox:
Index funds don’t actively vote on corporate governance issues.
So the more power they hold, the less oversight there is over company management.
📣 Bogle’s Proposals:
- Establish a code of conduct for index providers
- Require them to vote in investors’ interests
- Mandate transparency in how they use their voting power
"We fought for the democratization of investing. We cannot let it end in a new monarchy."
📘 Chapter 14: Personal Reflections — On Life, Mission, and Faith
🧬 Personal and Eternal:
Bogle shares his core life principles:
- To serve, not to own
- To leave a mark, not accumulate
- To do what’s right, not what’s profitable
He talks about his battle with heart disease — both as a personal journey and a metaphor for resisting the system.
🙏 Gratitude:
He dedicates the book to his family, colleagues, and investors.
Emphasizes: every day is a chance to be useful.
"I created Vanguard, but Vanguard created me. My career isn’t a triumph — it’s a thank you to fate for the chance to be heard."
📊 Summary of Chapters 12–14: Looking Ahead and Within
📌 Theme-----------------💬 Essence
Future of Investing---------Indexing is the new standard, but needs responsible stewardship
Concentration of Power----Index giants must be accountable to society
Personal Legacy-----------Life is about service, honesty, and setting an example
💬 Final Inspirational Quotes:
"Life isn’t about making more money. It’s about doing more good."
"One day, someone will say: ‘Bogle was stubborn. He never compromised his conscience.’ That will be the best reward."
🧩 Bogle’s Principle Summary (from the book):
- Lower costs — pay less = keep more
- Don’t chase returns — be realistic
- Be a long-term investor — ignore market noise
- Invest broadly, passively, regularly
- Don’t try to beat the market — own the market
- Focus on goals, not trends
- Finance = service. Not a business for profit
💡 Investment Philosophy
🟨 “This is a business where you get what you don’t pay for.”
🟨 “Don’t try to beat the market. Just own it.”
🟨 “In the stock market, investors are rewarded for patience and punished for frenzy.”
🟨 “Gross return minus costs = market return. After costs — less. So: reduce costs — and you win.”
🟨 “The problem isn’t that investors know too little. The problem is they know too much of what doesn’t matter.”
🧭 Principles & Morality
🟩 “Investing is not a business. It’s a service.”
🟩 “Honesty isn’t a strategy. It’s an obligation.”
🟩 “The goal of Vanguard isn’t to make more, but to return to the investor what’s rightfully theirs.”
🟩 “If your investments keep you up at night, change them. Or better — change yourself.”
🧠 On Leadership and Mission
🔷 “A leader isn’t the one in front. It’s the one responsible for the rest.”
🔷 “Respect isn’t bought. It’s earned when you do what’s right, even if it’s unpopular.”
🔷 “We didn’t build Vanguard for glory. We built it to leave something better than what was.”
💬 On the Market and Industry
🔴 “Today's stock market isn’t a place for investors. It’s a casino with a shiny sign.”
🔴 “We’re not against capital. We’re against capitalism without a conscience.”
🔴 “The people selling investments always say they can pick the best. But what if the best is just paying less?”
❤️ On Life and Legacy
💠 “I created Vanguard, but Vanguard created me. It’s not my victory — it’s gratitude for the chance to serve.”
💠 “Every day is a chance to do something not for yourself.”
💠 “You can measure success with money. Or with a conscience, you don’t have to justify.”
It was a lot of work!
Click to like + Write in the comments your favorite books about the financial market
Best regards, EXCAVO
_____________________
Disclosure: I am part of Trade Nation's Influencer program and receive a monthly fee for using their TradingView charts in my analysis.
Index

18 Times, +2000%, 5800 Days - All About NASDAQ100 Corrections!Hi, all!
I need to repost some of my recent ideas on TradingView due to issues with the platform's moderation. Let's start! The most up-to-date post is coming right away - one that serves as a timely reminder during these interesting times: never forget history.
From November 2008 to February 2025, the Nasdaq 100 (NDX) index has grown by over 2000%! Yes, that’s a 20x increase! This tech giant, made up of the 100 leading technology stocks, has shown impressive strength.
For comparison, the S&P 500 has risen about 820% in the same period. A great performance but Nasdaq 100 leaves it far behind.
Has this been a straight-line rise? Not really. Looking back, it may seem like the perfect investment. But the road was not smooth. Nasdaq 100’s success came with painful drops, investor panic, and moments when it felt like the market would never recover.
From the outside, everything looks great. But would you sit through a 30% drop, while the news is screaming about the "end of the world"?
So, I decided to analyze every correction of 10% or more since the market bottom in 2008.
- How long do corrections and recoveries last?
- How often do they happen?
- What should investors know?
- Can this help you in any way?
DATA ANALYSIS - 18 corrections in Nasdaq 100 (2008–2025), -10% or more.
Retracement Stats:
- Average drop: -15%
- Median drop: -13%
- Biggest drop: -37.72%
- Smallest drop: -10%
Correction Length (17 completed corrections): How many days does a correction last from the peak to the bottom?
- Average: 60 days
- Median: 35 days
- Longest: 325 days
- Shortest: 14 days
Recovery Time: From bottom back to new highs.
- Average: 165 days (~5.5 months)
- Median: 119 days (~4 months)
- Longest: 752 days (over 2 years)
- Shortest: 42 days (~1.5 months)
Correction Frequency
If we take a rough estimate, in 5800 days, there were 18 corrections, which means a correction happens every 322 days (~10.5 months) on average.
Total Time Spent in Corrections vs. Rising Markets
- Corrections lasted 1016 days
- Recoveries lasted 2801 days
- Total time spent in "work mode": 3817 days
- Total "smooth uptrend" days: 1983 days (~5.4 years)
Basically, like a hardworking employee – the market spends more time struggling than rising!
What Can Investors Learn from This?
1. Accept Volatility
Knowing that market swings are normal, investors can keep a long-term perspective and avoid panic-selling during downturns.
2. Nasdaq 100 Has Always Recovered
In the long run, Nasdaq 100 has always bounced back to new highs. Each recovery has been different, but so far, making new all-time highs has never been a problem.
3. Make Better Decisions
Understanding psychological biases helps investors make rational choices and manage risks better.
4. Market Drops = Opportunities, Not Threats
Most big market rallies started when most investors were too scared to buy.
"A simple rule dictates my buying: Be fearful when others are greedy, and be greedy when others are fearful." – Warren Buffett
Market drops always feel unique and scary but history shows they follow repeating patterns. And those who keep their emotions in check have the best opportunities.
"The time to buy is when there's blood in the streets." – Baron Rothschild
Final Thoughts: Is the current retracement a buying opportunity? No one knows for sure but history suggests - stay calm!
So, that's all. Like & Boost if you find this useful! 🚀
Have great day,
Vaido
💬 Before you leave... What’s your take on the current Nasdaq 100 correction? Drop your thoughts in the comments 👇
Index Investing: A Practical Approach to Market ParticipationIndex Investing: A Practical Approach to Market Participation
Index investing has become a popular way for traders and investors to access the broader market. By tracking the performance of financial indices like the S&P 500 or FTSE 100, index investing offers diversification, lower costs, and steady exposure to market trends. This article explores how index investing works, its advantages, potential risks, and strategies to suit different goals.
Index Investing Definition
Index investing is a strategy where traders and investors focus on tracking the performance of a specific financial market index, such as the FTSE 100 or S&P 500. These indices represent a collection of stocks or other assets, grouped to reflect a segment of the market. Instead of picking individual assets, index investors aim to match the returns of the entire index by investing in a fund that mirrors its composition.
For example, if an investor puts money in a fund tracking the Nasdaq-100, it’s effectively spread across all companies in that index, including tech giants like Apple or Microsoft. This approach provides instant diversification, as the investor is not reliant on the performance of a single stock.
This style of investing is often seen as a straightforward way to gain exposure to broad market trends without the need for active stock picking. Many investors choose exchange-traded funds (ETFs) for this purpose, as they trade on stock exchanges like individual shares and often come with lower fees compared to actively managed funds.
How Index Investing Works
Indices are constructed by grouping a selection of assets—usually stocks—to represent a specific market or sector. For instance, the S&P 500 includes 500 large-cap US companies, weighted by their market capitalisation. This means larger companies like Apple and Amazon have a greater impact on the index performance than smaller firms. The same principle applies to indices like the FTSE 100, which represents the 100 largest companies listed on the London Stock Exchange.
Index funds aim to mirror the performance of these indices. Fund managers have two primary methods for this: direct replication and synthetic replication. With direct replication, the fund buys and holds every asset in the market, matching their exact proportions. For example, a fund tracking the Nasdaq-100 would hold shares of all 100 companies in that index.
Synthetic replication, on the other hand, uses derivatives like swaps to mimic the index's returns without directly holding the assets. This method can reduce costs but introduces counterparty risk, as it relies on financial agreements with third parties.
Because index investing doesn’t involve constant buying and selling of assets, funds typically have lower management fees compared to actively managed portfolios. Fund managers don’t need to research individual stocks or adjust holdings frequently, making this a cost-efficient option for gaining exposure to broad market trends.
Advantages and Disadvantages of Index Investing
Index investing has become a popular choice for those looking for a straightforward way to align their portfolios with market performance. However, while it offers some clear advantages, there are also limitations worth considering. Let’s break it down:
Advantages
- Diversification: By investing in an index fund, investors gain exposure to a broad range of assets, reducing the impact of poor performance from any single stock. For instance, tracking the S&P 500 spreads investments across 500 companies.
- Cost-Efficiency: Index funds often have lower fees compared to actively managed funds because they require less trading and oversight. Passive management keeps costs low, which can lead to higher net returns over time.
- Transparency: Indices are publicly listed, so investors always know which assets they are invested in and how those assets are weighted.
- Consistent Market Exposure: These funds aim to match the performance of the market segment they track, providing reliable exposure to its overall trends.
- Accessibility: As exchange-traded funds (ETFs) are traded on stock exchanges, this allows investors to buy into large markets with the same simplicity as purchasing a single stock.
Disadvantages
- Limited Flexibility: Index funds strictly follow the composition of the underlying assets, meaning they can’t respond to other market opportunities or avoid underperforming sectors.
- Market Risk: Since these funds mirror the broader market, they’re fully exposed to downturns. If the market drops, so will the fund’s value.
- Tracking Errors: Some funds may not perfectly replicate an index due to fees or slight differences in holdings, which can cause performance to deviate.
- Lack of Customisation: Broad-based investing doesn’t allow for personalisation based on individual preferences or ethical considerations.
Index Investing Strategies
Index investing isn’t just about buying a fund and waiting—an index investment strategy can be tailored to suit different goals and market conditions. Here are some of the most common strategies investors use:
Buy-and-Hold
This long-term index investing strategy involves purchasing an index fund and holding it for years, potentially decades. The aim is to capture overall market growth over time, which has historically trended upwards. This strategy works well for those who value simplicity and are focused on building wealth gradually.
Sector Rotation
Some investors focus on specific sectors within indices, such as technology or healthcare, depending on economic trends. This strategy can help take advantage of sectors expected to outperform while avoiding less promising areas. For instance, in periods of economic downturn, investors might allocate funds to the MSCI Consumer Staples Index, given consumer staples’ defensive nature.
Dollar-Cost Averaging (DCA)
Rather than investing a lump sum, this index fund investing strategy involves putting money away regularly—say monthly—into indices, regardless of market performance. DCA reduces the impact of market volatility by spreading purchases over time.
The Boglehead Three-Fund Index Portfolio
Inspired by Vanguard founder John Bogle, this strategy is a popular approach for simplicity and diversification. It involves splitting index investments across three areas: a domestic stock fund, an international stock fund, and a bond fund. This mix provides broad market exposure and balances growth with risk. According to theory, the strategy is cost-efficient and adaptable to individual risk tolerance, making it a favourite among long-term index investors.
Hedging with Index CFDs
Traders looking for potential shorter-term opportunities might use index CFDs to hedge against broader market movements or amplify their exposure to a specific trend. With CFDs, traders can go long or short, depending on their analysis, without owning the underlying funds or shares.
Who Usually Considers Investing in Indices?
Index investing isn’t a one-size-fits-all approach, but it can suit a variety of investors depending on their goals and preferences. Here’s a look at who might find this strategy appealing:
Long-Term Investors
For those with a long investment horizon, such as individuals saving for retirement, this style of investing offers a practical way to grow wealth over time. By capturing the overall market performance, investors can build a portfolio that aligns with steady, long-term trends.
Passive Investors
If investors prefer a hands-off approach, index funds can be an option. They require minimal effort to maintain, as they simply track the performance of the market. This makes them appealing to those who want exposure to the markets without constantly managing their investments.
Cost-Conscious Investors
These passive funds typically have lower management fees than actively managed funds, making them attractive to those who want to minimise costs. Over time, this cost-efficiency might enhance overall returns.
Diversification Seekers
Investors who value broad exposure will appreciate the inherent diversification of index funds. By investing in an index, they’re spreading risks across dozens—or even hundreds—of assets, reducing reliance on any single stock.
CFD Index Trading
However, not everyone wants and can invest in funds. Index investing may be very complicated and require substantial funds. It’s where CFD trading may offer an alternative way to engage with index investing, giving traders access to markets without needing to directly own the underlying assets.
With CFDs, or Contracts for Difference, traders can speculate on the price movements of an index—such as the S&P 500, FTSE 100, or DAX—whether the market is rising or falling. This flexibility makes CFDs particularly appealing to those who want to take a more active role in the markets.
One key advantage of CFDs is the ability to trade with leverage. Leverage allows traders to control a larger position than their initial capital, amplifying potential returns. For instance, with 10:1 leverage, a $1,000 deposit can control a $10,000 position on an index. However, it’s crucial to remember that leverage also increases risk, magnifying losses as well as potential returns.
CFDs also enable short selling, allowing traders to take advantage of bearish market conditions. If a trader analyses that a specific index may decline, they can open a short position and potentially generate returns from the downturn—a feature not easily accessible with traditional funds.
CFDs can also be used to trade stocks and ETFs. For example, stock CFDs let traders focus on individual companies within an index, such as Apple or Tesla, without needing to buy the shares outright. ETF CFDs, on the other hand, allow for diversification across sectors or themes, mirroring the performance of specific industries or broader markets.
One notable feature of CFD trading is its accessibility to global markets. From the Nikkei 225 in Japan to the Dow Jones in the US, traders can access indices from around the world, opening up potential opportunities in different time zones and economies.
In short, for active traders looking to amplify their exposure to indices or explore potential short-term opportunities, CFD trading can be more suitable than traditional indices investing.
The Bottom Line
Index investing offers a practical way to gain market exposure, while trading index CFDs adds flexibility for active traders. With CFDs, you can get exposure to indices, ETFs and stocks. Moreover, you can take advantage of both rising and falling prices without the need to wait for upward trends. Whether you're aiming for long-term growth or potential short-term opportunities, combining these approaches can diversify your strategy.
With FXOpen, you can trade index, stock, and ETF CFDs from global markets, alongside hundreds of other assets. Open an FXOpen account today to explore trading with low costs and tools designed for traders of all levels. Good luck!
FAQ
What Is Index Investing?
Index investing involves tracking the performance of a specific financial market index, such as the S&P 500 or FTSE 100, by investing in funds that mirror the index. It provides broad market exposure and is often seen as a straightforward, passive investment strategy.
What Are Index Funds?
Index funds are financial instruments created to mirror the performance of a particular market index. They’re commonly structured as mutual funds or ETFs. At FXOpen, you can trade CFDs on a wide range of ETFs, including the one that tracks the performance of the S&P 500 index.
What Makes Indices Useful?
Indices offer a benchmark for understanding market performance and provide a way to diversify investments. By representing a segment of the market, they allow investors and traders to gain exposure to multiple assets in one investment.
Is It Better to Invest in Indices or Stocks?
It depends on your goals. According to theory, indices provide diversification and potentially lower risk compared to picking individual stocks, but stocks might offer higher potential returns. Many traders and investors combine both approaches for a balanced portfolio.
Does Index Investing Really Work?
As with any financial asset, the effectiveness of investing depends on an investor’s or trader’s trading skills and strategy. According to theory, the S&P 500 has averaged annual returns of about 10% over several decades, making index investments potentially effective. However, this doesn’t mean index investing will work for everyone.
What Are the Big 3 Index Funds?
The "Big 3" index funds often refer to those from Vanguard, BlackRock (iShares), and State Street (SPDR), which collectively manage a significant portion of global fund assets. For example, at FXOpen, you can trade CFDs on SPDR S&P 500 ETF Trust (SPY) tracking the S&P 500 stock market index and Vanguard High Dividend Yield ETF (VYM) which reflects the performance of the FTSE High Dividend Yield Index.
This article represents the opinion of the Companies operating under the FXOpen brand only. It is not to be construed as an offer, solicitation, or recommendation with respect to products and services provided by the Companies operating under the FXOpen brand, nor is it to be considered financial advice.

What Indicators Do Traders Use for Scalping? What Indicators Do Traders Use for Scalping?
Scalping is a fast-paced trading style where traders aim to take advantage of small price movements within short timeframes. Such traders often rely on technical indicators to make quick decisions. This article explores some of the most popular scalping indicators, providing insights into how they can help traders spot opportunities in fast-moving markets.
Understanding Scalping Indicators
As you know, scalping is a trading strategy where traders aim to take advantage of small price movements by executing numerous trades within short timeframes, often closing trades within a few minutes. This approach requires swift decision-making and precise timing.
Technical indicators are essential tools in this context, as they provide real-time data and insights into market trends, momentum, and volatility. Using these indicators, traders can identify optimal entry and exit points, potentially enhancing their ability to navigate the rapid pace of the market.
Below, we’ll break down five indicators for scalping. You’ll find these scalping indicators in MT4 and MT5, TradingView. Also, you can get started in seconds with FXOpen’s free TickTrader trading platform.
Moving Averages
Moving averages (MAs) are considered by some to be the best indicator for scalping, smoothing out price data to help identify trends by calculating the average price over a specific period. In scalping, where quick decisions are crucial, certain types of moving averages can be useful.
Exponential Moving Average (EMA)
Unlike the Simple Moving Average (SMA), which assigns equal weight to all data points, the EMA gives more significance to recent prices, making it more responsive to current market movements. This responsiveness is advantageous for scalpers. For instance, a 9-period EMA reacts swiftly to recent price changes, potentially providing timely signals for entry and exit points.
Hull Moving Average (HMA)
Developed by Alan Hull, the HMA further reduces lag and enhances smoothness compared to traditional moving averages. It achieves this by weighting recent prices more heavily and using a unique calculation method. The HMA's ability to closely follow price action while minimising lag makes it a valuable indicator for scalpers.
Applying Moving Averages in Scalping
- Crossover Strategy: Scalpers often use two EMAs of different lengths to identify potential trading opportunities. A common approach involves a fast EMA (e.g., 5-period) and a slow EMA (e.g., 15-period). When the fast EMA crosses above the slow EMA, it may indicate a bullish trend, suggesting a potential buying opportunity or a chance to close a short trade. Conversely, when the fast EMA crosses below the slow EMA, it may signal a bearish trend, indicating a potential selling opportunity or moment to close a long trade.
- Trend Confirmation: The EMA and HMA can be used to confirm trends identified by other indicators. For example, if the moving average is sloping upwards, it may confirm an uptrend, supporting decisions to enter long positions. If it's sloping downwards, it may confirm a downtrend, supporting decisions to enter short positions.
You can find these scalping indicators in TradingView and FXOpen’s TickTrader platform.
Relative Strength Index (RSI)
The Relative Strength Index (RSI) is a well-known scalping indicator that measures the speed and change of price movements, oscillating between 0 and 100. Traditionally, an RSI above 70 indicates overbought conditions, while below 30 suggests oversold conditions.
In scalping, traders often adjust the RSI from its typical length of 14 to shorter periods, such as 7 or 9, to capture rapid price swings occurring over minutes. This adjustment makes the RSI more sensitive to recent price changes, providing timely signals for quick trades.
Applying RSI in Scalping
- Overbought/Oversold Levels: When the RSI moves beyond 70 or drops below 30, traders watch for potential reversal points. However, scalpers may focus on the RSI’s movement back into the 30-70 range as an early sign of momentum shifting.
- Divergences: Scalpers also look for divergence between price movement and the RSI. For example, if the price reaches a new high but the RSI does not, it may signal a weakening trend and possible reversal. This divergence can be an effective tool for anticipating quick market shifts.
- Midpoint (50 Level): The 50 level serves as a midpoint, indicating the balance between gains and losses. An RSI crossing above 50 may suggest bullish momentum, while dropping below 50 can indicate bearish momentum. Scalpers use this midpoint to assess the prevailing market trend.
Bollinger Bands
Bollinger Bands are a technical analysis tool comprising three lines: a simple moving average (SMA) in the middle, with upper and lower bands set at a specified number of standard deviations from the SMA. These bands expand and contract based on market volatility, providing a visual representation of price fluctuations.
In scalping, traders often adjust Bollinger Bands to shorter timeframes, such as 1-minute or 5-minute charts, to capture quick price movements. A common approach involves setting the SMA period to 7-10 and the standard deviation to 1.5-2, potentially enhancing sensitivity to short-term market changes.
Applying Bollinger Bands in Scalping:
- Bollinger Squeeze: When the bands contract, indicating low volatility, it often precedes significant price movements. Scalpers watch for a breakout above or below the SMA to identify potential trading opportunities.
- Reversal: Price breaching the upper band may suggest overbought conditions, while below the lower band may indicate oversold conditions. Scalpers use these signals to anticipate potential price reversals.
Stochastic Oscillator
The Stochastic Oscillator is a momentum indicator that compares an asset’s closing price to its price range over a specific period, typically 14. It includes the %K line, the current closing price relative to the range, and the %D line, a moving average of %K. The scale runs from 0 to 100, where readings over 80 suggest overbought levels, and those under 20 point to oversold levels.
In scalping, traders may adjust the Stochastic Oscillator to shorter settings, such as 5,3,3, to increase sensitivity to rapid price movements. This adjustment can help in capturing short-term market fluctuations.
Applying the Stochastic Oscillator in Scalping:
- Overbought and Oversold Conditions: When the %K line crosses the %D line in the overbought (above 80) or oversold (below 20) zones, it can signal a potential reversal. Scalpers use these crossovers as quick alerts for shifts in momentum, helping them to act swiftly in volatile markets.
- Crossovers: Besides extreme conditions, traders also monitor crossovers between %K and %D. A %K line crossing above %D from a lower level can suggest an upward move, while a downward crossover may hint at a short-term price decline.
- Divergence: If the price makes a new high/low but the Stochastic Oscillator does not, it may signal a weakening trend, indicating a potential reversal.
Moving Average Convergence Divergence (MACD)
The Moving Average Convergence Divergence (MACD) is considered one of the top forex indicators for scalping. It’s a momentum indicator that reflects the relationship between two moving averages. It comprises the MACD line (the difference between the 12-period and 26-period exponential moving averages), the signal line (a 9-period EMA of the MACD line), and a histogram, which illustrates the gap between the two lines.
Scalpers prefer to adjust these settings to 3, 10, and 16, respectively, to make the MACD more responsive to rapid price movements.
Applying MACD in Scalping:
- Crossovers: When the MACD line crosses above the signal line, it may indicate bullish momentum; a crossover below suggests bearish momentum. Scalpers monitor these crossovers to identify potential entry and exit points.
- Histogram Analysis: The histogram represents the difference between the MACD and signal lines. An expanding histogram indicates strengthening momentum, while a contracting histogram reflects weakening momentum. Scalpers use these changes to gauge the intensity of price movements.
- Divergences: A divergence occurs when the price moves in one direction while the MACD line moves in the opposite. For example, if the price reaches a new low but the MACD does not, it may reflect a potential upward reversal. Scalpers watch for such divergences to anticipate shifts in market direction.
Combining Indicators for Scalping Strategies
Combining multiple indicators can enhance scalping strategies by providing a more comprehensive view of market conditions. Each indicator offers unique insights, and their combined use can help filter out false signals and confirm trading opportunities. Here are some pairings:
- EMA and RSI: Utilising the Exponential Moving Average to identify trend direction alongside the Relative Strength Index to gauge momentum can help traders confirm the strength of a trend before making decisions. For instance, if the EMA indicates an uptrend and the RSI is above 50, it may suggest strong bullish momentum.
- Bollinger Bands and Stochastic Oscillator: Bollinger Bands measure volatility, while the Stochastic Oscillator identifies overbought or oversold conditions. When prices touch the upper or lower bands and the Stochastic Oscillator reflects overbought or oversold conditions, it may indicate potential reversal points.
- MACD and RSI: The Moving Average Convergence Divergence (MACD) highlights momentum changes, and the RSI indicates overbought and oversold conditions. Using them together can help confirm potential entry or exit points. For example, if the MACD shows bullish momentum and the RSI is rising but not yet overbought, it may signal a buying opportunity.
Common Challenges When Using Indicators in Scalping
Scalping with indicators offers valuable insights, but there are some challenges traders should be aware of:
- False Signals: Rapid market movements can trigger misleading signals, causing traders to act prematurely.
- Overtrading: Relying too heavily on short-term indicators can lead to excessive trades, increasing transaction costs.
- Market Noise: High volatility and frequent price fluctuations can make it difficult to distinguish genuine trends from random market "noise."
- Lagging Indicators: Some indicators may react too slowly, causing traders to miss opportunities.
The Bottom Line
Scalping requires quick decisions and the right tools, and indicators like the EMA, RSI, and MACD can help traders navigate fast-moving markets. Found the best scalping indicator that suits your style? Open an FXOpen account to access four advanced trading platforms and start building your scalping strategy today with low-cost, high-speed trading conditions.
FAQ
What Is the 1-Minute Scalp Strategy?
The 1-minute scalp strategy involves making rapid trades on a 1-minute chart. Traders look for small price movements and enter multiple trades within a short period, often using scalp trading indicators like the EMA or RSI for quick signals.
What Is the 5-Minute Scalping Strategy?
The 5-minute scalping strategy focuses on capturing short-term price movements on a 5-minute chart. Traders typically combine trend and momentum indicators, like the MACD and Bollinger Bands, to make fast, informed decisions.
Which Stocks Are Good for Scalping?
The choice depends on the trader’s risk tolerance, trading approach, experience, and toolkit. However, according to theory, stocks with high liquidity, tight spreads, and significant daily volume are good for scalping. Popular choices include tech giants like Apple (AAPL) and Tesla (TSLA), as they offer frequent price fluctuations. But at the same time, they bear higher risks.
What Is the Best EMA for Scalping?
There is no best exponential moving average for scalping. However, traders often use a pair of EMAs, such as a 9- or 5-period and 21- or 15-period, to quickly respond to price changes in scalping. These EMAs help identify trend direction and momentum.
How Can You Use RSI for Scalping?
In scalping, the RSI is often set to shorter periods, like 7 or 9, to catch signals quickly. Traders watch for the RSI to cross key levels (30 or 70) and form a divergence with a price chart to spot potential reversals.
This article represents the opinion of the Companies operating under the FXOpen brand only. It is not to be construed as an offer, solicitation, or recommendation with respect to products and services provided by the Companies operating under the FXOpen brand, nor is it to be considered financial advice

1-Minute Scalping Trading Strategies With Examples1-Minute Scalping Trading Strategies With Examples
Scalping is a popular trading style capitalising on rapid, small price movements within minutes. 1-minute scalping strategies are often used by traders but require precise execution and solid understanding of technical indicators. This article explores four 1-min scalping strategies, detailing the indicators used alongside specific entries and exits.
Understanding 1-Minute Scalping
1-minute scalping is a fast-paced trading style focusing on taking advantage of small price movements within a minute timeframe. Traders using this approach rely on 1-minute charts to make quick, multiple trades throughout the trading session. The primary goal is to accumulate potential small gains that might add up to larger returns over time.
A scalp trading strategy requires a solid understanding of technical analysis and market conditions. Scalpers typically use indicators, price action patterns, and trend analysis to identify short-term market movements and potential entry and exit points. The rapid nature of 1-minute scalping demands precision and discipline, as even a slight delay can impact the trade outcome.
One of the key advantages of 1-minute scalping is the ability to generate frequent trading opportunities, which can be particularly appealing during volatile market conditions. However, it also comes with higher risks due to the speed and frequency of trades, meaning risk management plays a significant role.
Scalpers must also be aware of transaction costs, as frequent trading can lead to significant fees, which can erode potential returns. Choosing a broker with low commissions, tight spreads, and fast execution speeds is essential to maximise a scalping forex strategy’s potential. FXOpen provides an ideal environment for scalping trading strategies, with commissions from $1.50 per lot, spreads from 0.0 pips, and ultra-fast execution. Open an account!
Four 1-Minute Scalping Strategies
Now, let’s take a closer look at four 1-minute trading strategies. To apply these strategies, see how they work in practice, and access each of these 1-minute scalping indicators, consider following along in FXOpen’s free TickTrader trading platform.
Strategy 1: VWAP + MACD
Indicators Used
- VWAP (Volume Weighted Average Price): VWAP calculates the average price a security has traded at throughout the day, based on both volume and price. It helps traders understand the trend and identify potential support and resistance levels.
- MACD (Moving Average Convergence Divergence): MACD is an indicator that visualises the relationship between two moving averages. MACD settings for a 1-minute chart are standard: the MACD line is derived from the difference between the 12-period and 26-period exponential moving averages (EMA), while the signal line is a 9-period EMA of the MACD line.
VWAP and MACD work well together by providing both trend and momentum analysis. VWAP helps identify the overall trend and significant price levels, while MACD offers insights into momentum changes. This combination can help traders determine entries by confirming trends and potential reversals.
Entry
- Traders typically look for the price to close through the VWAP, with the MACD turning from positive to negative or vice versa. This coincides with the signal line crossing over the MACD line.
- Alternatively, another common entry point is when the price uses the VWAP as a level of support or resistance, confirmed by the MACD turning from positive to negative or vice versa.
These triggers will likely occur within a few candles of each other, typically within 4 or 5 candles.
Stop Loss
- Stop losses are often set just beyond a recent high or low swing point, which helps potentially protect against losses if the market moves unexpectedly.
Take Profit
- Traders commonly take profits when the signal line crosses the MACD line in the opposite direction, and the histogram switches from positive to negative or vice versa. This approach allows traders to take advantage of momentum shifts and potentially lock in gains as the trend changes.
- However, some may prefer to exit at a significant support or resistance level in order to maximise potential gains.
Strategy 2: Keltner Channels + RSI
Indicators Used
- Keltner Channels: A volatility-based envelope set above and below an exponential moving average. The channels are typically set to two average true range (ATR) values away from the EMA. They help identify overbought and oversold conditions and potential breakouts.
- RSI (Relative Strength Index): A momentum oscillator that gauges the rate and extent of price changes. It ranges between 0 and 100, where readings above 70 signal overbought conditions, and readings below 30 indicate oversold conditions. RSI can also indicate bullishness when it crosses above 50 and vice versa.
The Keltner Channels and RSI strategy leverages volatility and momentum to identify effective trading opportunities. By combining the channels, which offer insights into breakouts, with the RSI, which gauges momentum, traders can uncover trading opportunities on the 1-minute chart.
Entry
- Traders often look for two or more closes outside of the Keltner Channel and ideally strong and/or consecutive green (bullish) or red (bearish) candles.
- This is confirmed by the RSI recently breaking above 50 for bullish signals or below 50 for bearish signals.
The combination of strong price action and momentum change helps traders identify potential trend continuations.
Stop Loss
- Stop losses are commonly set beyond the opposite side of the Keltner Channel to potentially protect against adverse price movements.
- For a higher risk-reward ratio, traders might place stop losses beyond a nearby swing candle.
Take Profit
- Traders typically take profits when the price crosses back beyond the Keltner Channel's midpoint or reaches the opposite side of the channel, indicating a potential exhaustion of the current move.
- Alternatively, profits may be taken when RSI moves beyond 70 (overbought) or below 30 (oversold), signalling potential reversals in price direction.
Strategy 3: ALMA + Stochastic
Indicators Used
- ALMA (Arnaud Legoux Moving Average): ALMA is a moving average that aims to smooth price data while reducing lag. The settings used are 21 for the window size, 0.85 for the offset, and 6 for the sigma. This combination helps in identifying the trend with greater precision.
- Stochastic Oscillator: The Stochastic measures the location of the close relative to the high-low range over a set period. Settings of 21, 1, 3 are used to capture momentum and potential reversal points. A figure above 80 signals overbought conditions, while below 20 indicates the opposite.
Combining ALMA with the Stochastic Oscillator allows traders to identify potential reversals in trends. ALMA provides a smoothed view of the price trend, while the Stochastic Oscillator offers momentum-based signals, helping to confirm the strength of a move.
Entry
- Traders look for the price to close through the ALMA, ideally with a strong close, which suggests a potential trend change.
- This is confirmed by the Stochastic Oscillator crossing below 80 for a bearish signal or above 20 for a bullish signal, indicating momentum alignment with the trend.
Note that price may fluctuate above and below the ALMA in ranging conditions and produce false signals.
Stop Loss
- Stop losses are typically set beyond the nearest swing point, which helps to potentially protect against adverse price movements.
Take Profit
- Traders typically take profits when the Stochastic reaches the opposite territory (e.g., from above 80 to below 20 for a bearish move), indicating a potential exhaustion of the current trend.
- Alternatively, profits may be taken at identified areas of support or resistance, where price action historically reacts, providing a logical exit point.
Strategy 4: RSI + Bollinger Bands
Indicators Used
- RSI (Relative Strength Index): For this strategy, RSI setting for a 1-minute chart is a length of 4, with overbought and oversold boundaries at 80 and 20, respectively. These RSI settings for the 1-minute chart help in identifying short-term overbought and oversold conditions.
- Bollinger Bands: Bollinger Bands settings for a 1-minute chart are a 20-period simple moving average (middle band) and two outer bands set at a standard deviation level of 2 from the middle band. They help identify periods of high and low volatility as well as potential reversal points.
The combination of RSI and Bollinger Bands allows traders to identify potential short-term reversals in the market. The Bollinger Bands provide a dynamic range for price action, while the RSI helps confirm overbought or oversold conditions, improving the accuracy of entry and exit points.
Entry
- Traders often enter when the RSI crosses below 80 from above or above 20 from below, signalling an exit from potential overbought or oversold conditions.
- This entry is confirmed when the price is also touching or breaching the Bollinger Band, indicating the likelihood of a short-term reversal.
Stop Loss
- Stop losses are typically set beyond a nearby swing point or just outside the Bollinger Band, providing potential protection against significant adverse price movements and giving the trade room to develop.
Take Profit
- Traders commonly take profits when the price touches the opposing Bollinger Band, suggesting a potential end to the current price move.
- Alternatively, some may take profits when the RSI crosses into the opposing overbought or oversold territory, indicating a shift in momentum.
The Bottom Line
Mastering a 1-minute scalping strategy can potentially enhance your trading performance. To take advantage of these techniques, consider opening an FXOpen account. As a regulated broker, FXOpen offers access to over 600 markets for scalping, supported by commissions as low as $1.50 and spreads from 0.0 pips. With the right tools and strategies, you can navigate today’s fast-paced trading environment effectively.
FAQ
What Is the 1-Minute Timeframe Trading Strategy?
The 1-minute timeframe trading strategy involves making multiple trades within a single minute, aiming to capture small price movements. Traders use a 1-min scalping strategy to identify quick trading opportunities and rely heavily on technical indicators for entry and exit points.
Which Indicator Is Best for 1-Minute Scalping?
There is no single best 1-minute scalping strategy indicator; it comes down to preference and experience. However, popular choices include the Moving Average Convergence Divergence (MACD), Relative Strength Index (RSI), Bollinger Bands, and the Volume Weighted Average Price (VWAP). Combining several indicators can potentially provide more reliable signals.
What Is the Best Timeframe for Scalping Crypto*?
The best timeframe for scalping crypto* depends on the trader's preference and strategy. While a 1-minute crypto* scalping strategy offers rapid trades and numerous opportunities, some traders prefer slightly longer frames like the 5-minute or 15-minute charts to balance speed and cryptocurrency* market noise.
What Is the Stochastic Setting for 1-Minute Scalping?
For 1-minute scalping, the Stochastic Oscillator is typically set to the standard settings of 14, 1, 3. These settings help capture short-term momentum changes, providing timely signals for entry and exit points. Adjustments can be made based on the trader's specific strategy and market conditions.
*At FXOpen UK, Cryptocurrency CFDs are only available for trading by those clients categorised as Professional clients under FCA Rules. They are not available for trading by Retail clients.
This article represents the opinion of the Companies operating under the FXOpen brand only. It is not to be construed as an offer, solicitation, or recommendation with respect to products and services provided by the Companies operating under the FXOpen brand, nor is it to be considered financial advice.

How Can You Use a Break and Retest Strategy in Trading?How Can You Use a Break and Retest Strategy in Trading?
Trading strategies help traders navigate the financial markets with greater confidence. One such approach is the break and retest strategy, which focuses on key support and resistance levels. This article explores the break and retest strategy in detail, providing insights and practical examples to help traders apply it in their trading activities.
Understanding the Break and Retest Strategy
The break and retest strategy is popular among traders who aim to capitalise on clear market movements. At its core, this strategy revolves around identifying key support and resistance levels on a price chart.
Here’s how it works: When the price breaks through a support or resistance level, it signals a potential shift in market sentiment. For example, if a stock breaks above a resistance level, it suggests increasing buying interest. Traders then watch for the price to return to this newly broken level—known as a retest in trading. During the retest, the former resistance now acts as support, providing a potentially more attractive entry point for traders looking to join the trend.
This strategy aligns well with trending markets, where prices move consistently in one direction. It allows traders to take advantage of momentum while managing their entries potentially more effectively.
The Mechanics of Break and Retest Trading
Implementing the break and retest strategy involves a clear sequence of steps that traders follow to identify and act on potential market moves. Here’s a breakdown of how this strategy typically operates:
1. Identifying Key Levels
Traders begin by pinpointing significant support and resistance levels on their charts. Accurate identification is crucial, as these levels form the foundation of the strategy.
2. Monitoring for a Breakout
Once the key levels are established, traders watch for the price to break through one of these barriers, in line with a broader trend. A breakout occurs when the price moves decisively above resistance or below support, often accompanied by increased trading volume. This surge in volume indicates stronger market interest and can validate the breakout’s legitimacy.
3. Waiting for the Retest
After the breakout, the price typically retraces to test the broken level. For instance, if the price breaks above a resistance level, it may pull back to that same level, which now acts as support. This retest phase is critical as it offers a second confirmation of the breakout’s strength.
4. Confirming the Retest
During the retest, traders look for confirmation signals to ensure the breakout is genuine. These signals can include specific candlestick patterns, such as pin bars or engulfing candles, and continued high trading volume. Successful confirmation suggests that the new support or resistance level will hold, increasing the likelihood of a sustained trend.
5. Entering the Trade
With confirmation in place, traders often enter the market, aiming to ride the new trend. They may set stop-loss orders slightly below the new support (in the case of a breakout to the upside) or the new resistance (in case of a breakout to the downside) to manage potential risks.
6. Managing the Trade
Effective trade management involves setting target levels based on previous price action and adjusting stop-loss orders as the trade progresses. This helps to lock in potential returns and potentially protect against unexpected market reversals.
Break and Retest Example Strategy
Consider this EURUSD 15-minute chart, which displays a clear bearish trend. This trend is highlighted by the 50-period Exponential Moving Average (EMA) sloping downward, with the price generally staying below it. Recently, the price broke below a key support level on higher-than-average volume, signalling a potential opportunity for traders to apply the break and retest strategy.
In this scenario, there are two support levels to monitor. The first is a more significant support level. Trading at this level can allow traders to enter the market quickly, though it comes with a less favourable risk-reward ratio.
The second support level is found within the recent brief retracement. This level offers a better risk-reward ratio, but there's a chance the price may not retrace deeply enough, potentially causing traders to miss the trade.
The entry point is identified by a candle with a wick longer than its body (a pin-bar on the 30m chart), indicating rejection of higher prices as the market retests the second broken support level. Once this candle closes, traders can enter a market order.
Stop losses would typically be placed either above the last major swing high or above the 50-period EMA, depending on individual risk tolerance. Take-profit targets could be set at a 1:3 risk-reward ratio or at the next significant support level, where a price reversal may be anticipated.
Improving the Break and Retest Strategy
Enhancing the break and retest strategy involves integrating additional tools and techniques to refine trade decisions. Here are several methods to consider:
1. Incorporating Additional Indicators
Using break and retest indicators like the Relative Strength Index (RSI) or the Moving Average Convergence Divergence (MACD) can provide valuable insights. For instance, an RSI crossing below 70 during a bearish breakout may indicate weakening momentum, supporting the retest. Similarly, the MACD crossing above its signal line or the MACD histogram rising above 0 can confirm the uptrend’s strength, aiding in more precise entry points.
Explore these indicators and more than 1,200+ trading tools in FXOpen’s free TickTrader trading platform.
2. Multi-Timeframe Analysis
Examining charts across different timeframes helps in gaining a broader market perspective. A breakout observed on a 4-hour chart gains additional confirmation when a strong trend is also visible on a daily chart. This alignment across timeframes increases the reliability of the trade setup.
3. Utilising Fibonacci Retracements
After a breakout, prices often retrace deeper into the previous high-low range—not always to the most extreme point. Applying Fibonacci retracements to the high/low of the breakout (high in a bearish breakout and low in a bullish scenario) and the new low or high can help identify optimal retest points, particularly at the 38.2%, 50%, and 61.8% levels. These levels typically offer better risk-reward ratios compared to the extreme points.
4. Incorporating Fundamental Analysis
Supporting technical breakouts with fundamental factors, such as economic reports or news events, strengthens the strategy. For example, a breakout aligned with positive economic data may have a higher probability of sustaining the new trend, providing traders with greater confidence in their decisions.
Advantages of the Break and Retest Strategy
The break and retest strategy offers several advantages that can enhance a trader’s approach to the markets:
- Increased Confidence through Confirmation: The retest serves as an additional validation of the breakout, boosting trader confidence in their entry decision and reducing hesitation.
- Better Risk Management: Setting stop-loss orders based on the retest level provides a clear risk boundary. This structured approach aids in potentially managing losses.
- Alignment with Market Trends: This strategy naturally aligns trades with the prevailing market trend. By trading in the direction of the breakout, traders can take advantage of sustained movements.
- Versatility Across Markets: The breakout and retest strategy can be applied to various financial instruments, including forex, stocks, and commodities. Its adaptability makes it a valuable tool in diverse trading environments.
- Scalability and Flexibility: This strategy can be adapted to different timeframes and trading styles, making it suitable for both short-term and long-term traders seeking to implement a consistent approach.
Potential Challenges and Considerations
While the break and retest strategy can be a powerful tool, traders may face several challenges when implementing it:
- False Breakouts: Not every breakout leads to a sustained trend. Sometimes, the price moves beyond a support or resistance level only to reverse shortly after. Recognising these false signals is crucial to avoid entering trades that may quickly turn against expectations.
- Market Conditions: According to theory, this strategy performs best in trending markets. In sideways or highly volatile environments, breakouts can be less reliable, making it harder to distinguish genuine opportunities from random price movements.
- Timing the Retest: Accurately determining when the price will retest the broken level can be challenging. Entering too early may expose traders to unnecessary risk, while waiting too long might result in missed opportunities if the retest doesn't occur as anticipated.
- Reliance on Confirmation Signals: While additional indicators like RSI or MACD can enhance the strategy, over-reliance on these tools can complicate decision-making. Traders need to balance multiple signals without becoming overwhelmed or confused.
- Emotional Discipline: Maintaining discipline during retests is essential. Traders might feel pressured to act quickly if the market moves unexpectedly, leading to impulsive decisions that deviate from their trading plan.
The Bottom Line
The break and retest strategy offers a structured approach to navigating market movements, combining precise entry points with effective risk management. By understanding and applying this method, traders can potentially enhance their trading decisions and align with prevailing trends. To put this strategy into practice across more than 700 markets, consider opening an FXOpen account and gain access to four advanced trading platforms, low trading costs, and rapid execution speeds.
FAQ
What Is a Retest in Trading?
A retest occurs when the price returns to a broken support or resistance level after an initial breakout. It serves to confirm the strength of the breakout, helping traders decide whether the new trend will continue or if the breakout was false.
What Is the Break and Retest Strategy?
The break and retest strategy involves identifying a breakout of a key support or resistance level and then waiting for the price to return to that level. Traders use this retest as a confirmation to enter the market, aiming to follow the new trend with reduced risk.
What Is the Win Rate of the Break and Retest Strategy?
The win rate of the break and retest strategy varies depending on market conditions and how the strategy is applied. Consistent application and effective risk management are crucial for achieving better results.
How Many Times Should I Backtest My Strategy?
Backtesting should be done extensively across different market conditions and timeframes. According to theory, traders need to test a strategy on at least 100 trades to ensure its reliability and to understand how it performs in various scenarios.
Does the Market Always Retest?
No, the market does not always retest broken levels. While retests are common, they are not guaranteed. Traders should use additional confirmation signals and be prepared for both possibilities when applying the break and retest strategy.
This article represents the opinion of the Companies operating under the FXOpen brand only. It is not to be construed as an offer, solicitation, or recommendation with respect to products and services provided by the Companies operating under the FXOpen brand, nor is it to be considered financial advice.

What Are Leading Trading Indicators, and How Can You Use ThemWhat Are Leading Trading Indicators, and How Can You Use Them in Trading?
Leading indicators are essential tools for traders aiming to analyse market movements. This article explains what leading indicators are, how they work, and their practical application across different asset classes. Read on to discover how tools like RSI, Stochastic Oscillator, On-balance Volume, and Fibonacci retracements can enhance your trading strategy.
What Are Leading Technical Indicators?
Technical indicators are divided into leading and lagging. Leading indicators in trading are tools used to identify potential price movements before they occur. Lagging indicators confirm trends after they begin, helping traders validate price movements. The difference between leading and lagging indicators is that leading indicators aim to give traders an edge by signalling when a new trend or reversal might be on the horizon while lagging indicators confirm trends after they've developed.
Leading trading indicators work by analysing price data to identify patterns or extremes in buying and selling behaviour. For instance, popular leading indicators like the Relative Strength Index (RSI) and the Stochastic Oscillator measure momentum in a market. These indicators help traders spot overbought or oversold conditions, where RSI tracks recent price movements relative to historical performance, while the Stochastic Oscillator compares a security's closing price to its price range over a set period.
However, it’s important to note that leading indicators can produce false signals, meaning they may suggest a price move that doesn’t materialise. Because of this, traders often combine them with other technical analysis tools, such as support and resistance levels, or use them alongside lagging indicators to validate the signals they receive.
Types of Leading Indicators in Trading
Leading indicators are divided into various types, each serving a unique role in analysing potential market movements. Three common types include momentum indicators, oscillators, and volume indicators:
- Momentum Indicators: These track the speed or rate of price changes. They are used to assess the strength of a trend and determine potential reversals when the momentum slows. Momentum indicators help traders when an asset is overbought or oversold.
- Oscillators: These indicators fluctuate between fixed values (usually 0 and 100) to reflect the market’s current momentum. They help traders pinpoint potential reversals by highlighting when an asset is overbought or oversold. Oscillators are particularly useful in range-bound markets where price movement is confined within support and resistance levels.
- Volume Indicators: These focus on the amount of trading activity, rather than price movement. By analysing the flow of volume in or out of an asset, traders can gauge the strength behind price movements. Increasing volume in the direction of a trend often confirms its continuation, while the divergence between volume and price can indicate potential reversals.
Below, we’ll take a look at a list of leading indicators. If you’d like to explore these indicators alongside dozens more, head over to FXOpen’s free TickTrader trading platform.
Relative Strength Index (RSI)
The Relative Strength Index (RSI) is one of the most popular leading indicators examples. RSI is a momentum oscillator that helps traders evaluate the strength of an asset’s price movements. Developed by J. Welles Wilder, it measures the speed and change of price actions over a set period—typically 14 candles—on a scale from 0 to 100.
The primary signals RSI produces revolve around overbought and oversold conditions. When the indicator breaks above 70, it suggests that an asset may be overbought, reflecting the potential for a reversal or correction. Conversely, when RSI falls below 30, it signals that an asset may be oversold, which can indicate a potential recovery. These thresholds provide traders with insight into whether the price has moved too far in one direction and is poised for a change.
RSI can also highlight trend reversals through divergence. If the price of an asset continues to rise while the RSI drops, it indicates bearish divergence, signalling potential weakening momentum. On the other hand, bullish divergence occurs when the price falls, but the RSI rises, suggesting that the downward trend may be losing strength.
Another useful RSI signal is when it crosses the 50-level. In an uptrend, RSI remaining above 50 can confirm momentum, while in a downtrend, staying below 50 reinforces bearish sentiment.
However, RSI is not foolproof. During a strong trend, the indicator can signal overbought or oversold for a long while and lead to false signals. This is why it’s often paired with other indicators to confirm signals.
Stochastic Oscillator
The Stochastic Oscillator is a momentum-based indicator that assesses the relationship between an asset's closing price and its price range over a specific number of periods, typically 14. It consists of two lines: the %K line, the primary line, and the %D line, which is a moving average of %K, providing smoother signals.
This oscillator ranges from 0 to 100, with readings above 80 indicating overbought conditions and those below 20 signalling oversold conditions. Traders utilise these signals to determine potential reversals in price. For example, when the oscillator rises above 80 and then drops below it, a potential sell signal is generated. Conversely, when it falls below 20 and climbs back above, it might indicate a buy opportunity.
The Stochastic Oscillator also provides crossover signals, where the %K line crosses above or below the %D line. A bullish crossover occurs when %K rises above %D, indicating that upward momentum may be increasing. A bearish crossover happens when %K falls below %D, suggesting that momentum is shifting downward.
In addition to overbought/oversold and crossovers, the Stochastic Oscillator can identify divergence, which signals potential trend reversals. A bullish divergence occurs when the price makes a lower low, but the oscillator shows a higher low, indicating a weakening downward momentum. On the other hand, a bearish divergence happens when the price makes a higher high, but the oscillator makes a lower high, suggesting the uptrend might be losing steam.
While the Stochastic Oscillator can be powerful in range-bound markets, it can be prone to false signals in trending markets.
On-Balance Volume (OBV)
On-Balance Volume (OBV) is an indicator that tracks the flow of trading volume to assess whether buying or selling pressure is dominating the market. It was introduced by Joseph Granville in 1963, and its primary concept is that volume precedes price movements. This makes OBV a useful tool for analysing potential trend reversals. While the absolute value of OBV is not crucial, its direction over time provides insight into the market’s underlying sentiment.
OBV offers several key signals:
- Trend Direction: A rising OBV supports an upward price trend, indicating strong buying pressure, while a falling OBV reflects a downtrend with selling pressure.
- Divergence: Traders use OBV to identify a divergence between price and volume. If the price is making new highs while OBV is falling, it suggests a weakening trend, potentially signalling a reversal. Conversely, rising OBV with falling prices can hint at a potential bullish reversal.
- Breakouts: OBV can also be used to spot potential breakouts. For instance, if OBV rises while prices are range-bound, it may indicate an upcoming upward breakout.
However, like any indicator, OBV has limitations. It can produce false signals in choppy markets and is used alongside other technical tools, such as Moving Averages or support and resistance levels, to improve reliability.
Fibonacci Retracement
Fibonacci retracements are a technical analysis tool that helps traders pinpoint potential support and resistance levels during price fluctuations. The tool is based on the Fibonacci sequence, a series of numbers that produce key ratios like 23.6%, 38.2%, 61.8%, and 78.6%. These percentages represent levels where the price of an asset might retrace before continuing its trend.
Traders apply Fibonacci retracement by selecting two extreme points on a price chart, such as a recent high and low. The tool then plots horizontal lines at the Fibonacci levels, indicating possible areas where the price might pause or reverse. For example, in an uptrend, a price pullback to the 38.2% level could signal a buying opportunity if the trend is likely to resume.
Fibonacci retracements are often used in conjunction with other indicators, such as the MACD or RSI, to confirm signals and enhance reliability. While they provide valuable insight into potential turning points, it's crucial to remember that these levels aren't guarantees—prices may not always behave as expected at these points, especially in volatile markets.
How Traders Use Leading Indicators in Practice
Traders use leading indicators to gain insights into potential price movements before they occur, helping them position themselves early in a trend. Here’s how leading indicators are typically applied:
- Identifying Overbought or Oversold Conditions: Indicators like RSI or Stochastic Oscillator are used to spot extreme price levels. When these indicators signal that a market is overbought or oversold, traders analyse the situation for potential trend reversals.
- Combining Indicators for Confirmation: It’s common to pair multiple leading indicators to strengthen signals. For example, a trader might use both the RSI and OBV to confirm momentum shifts and avoid acting on false signals.
- Spotting Divergences: Traders look for divergence between an indicator and price action. For instance, if prices are rising, but the indicator is falling, it can suggest weakening momentum, signalling a potential downward reversal.
- Clear Entry and Exit Points: Leading indicators often provide clear entry and exit points. For instance, the Stochastic Oscillator signals a bearish reversal and entry point when it crosses back below 80, with traders typically exiting the trade when the indicator crosses above 20. Likewise, Fibonacci retracements can provide precise levels where a trend might stall or reverse.
Potential Risks and Limitations of Leading Indicators for Trading
While leading indicators offer valuable insights into potential price movements, they come with risks and limitations.
- False Signals: One of the biggest challenges is that leading indicators can generate false signals, especially in volatile markets. For instance, an indicator might signal a reversal, but the price continues in its original direction, leading traders to take positions prematurely.
- Limited Accuracy in Trending Markets: It’s common that in strong trends, such indicators remain overbought or oversold for extended periods, causing traders to misinterpret momentum.
- Overreliance on One Indicator: No single indicator is foolproof. Relying heavily on one without considering other factors can lead to poor decisions. Traders need to combine leading indicators with other tools like support/resistance levels or trendlines to validate signals.
- Lagging in Fast-Moving Markets: Even though they are called "leading" indicators, they can sometimes lag in rapidly changing markets. By the time a signal is generated, the opportunity may have already passed.
The Bottom Line
Whether trading forex, commodities, or the stock market, leading indicators offer valuable insights to help traders anticipate potential price movements. By combining these tools with a solid strategy, traders can better navigate market conditions. To start implementing these insights across more than 700 markets, consider opening an FXOpen account and take advantage of our high-speed, low-cost trading conditions.
FAQ
What Are the Leading Indicators in Trading?
Leading indicators are technical analysis tools used to determine potential price movements before they happen. Traders use them to anticipate market shifts, such as reversals or breakouts, by analysing price momentum or trends. Common examples include the Relative Strength Index (RSI), Stochastic Oscillator, and Fibonacci retracement levels.
What Are the Three Types of Leading Indicators?
The three main types of leading indicators for trading are momentum indicators (e.g., Momentum (MOM) indicator), oscillators (e.g., Stochastic), and volume indicators (e.g., On-Balance Volume). These tools help determine market direction by assessing price action or trading volume.
Is RSI a Leading Indicator?
Yes, RSI (Relative Strength Index) is a leading indicator. Considered one of the potentially best leading indicators for day trading, it measures momentum by comparing recent gains and losses, helping traders spot overbought or oversold conditions before potential reversals.
This article represents the opinion of the Companies operating under the FXOpen brand only. It is not to be construed as an offer, solicitation, or recommendation with respect to products and services provided by the Companies operating under the FXOpen brand, nor is it to be considered financial advice.

Trading with RSI: The Bad, The Good and Even BetterIn this video I explain how to use RSI (Relative Strength Index) to make trading decisions. You'll learn how to properly use RSI oversold condition, combining low timeframe price action signals with high level context analysis.
Besides of explaining three different strategies (the bad, the good and even better) I'll do back-testing on historical data to demonstrate how those strategies translate into real trading results.
Disclaimer
I don't give trading or investing advice, just sharing my thoughts.

Indicators for trading using Bill Williams' Profitunity strategyI published 3 indicators for trading using Bill Williams' Profitunity strategy. For each indicator, I have added a visual and detailed description in English and Russian. In this post I will briefly describe these indicators and how I use them together.
AFDSA indicator (Alligator + Fractals + Divergent & Squat Bars + Signal Alerts)
Includes Williams Alligator, Williams Fractals, Divergent Bars, Market Facilitation Index, Highest and Lowest Bars, maximum or minimum peak of the Awesome Oscillator, and signal alerts based on Bill Williams' Profitunity strategy:
Bullish and Bearish Divergent Bar Signal + Squat Bar + Green Bar + Fake Bar + Awesome Oscillator Color Change + AO Divergence.
Crossing the green line (Lips) of an open Alligator.
Formation of a fractal.
Signal about the breakdown of the last upper or lower fractal.
Signal about the appearance of a new maximum or minimum peak of AO in the interval of 140 bars from the last bar.
I also added an Alligator display for the higher timeframe, for example, if the chart timeframe is 1 hour, then the higher timeframe will automatically be 4 hours, if the chart timeframe is 4 hours, then the higher timeframe will be 1 day, etc.
AOE Oscillator (Awesome Oscillator + Bars count lines + EMA Line)
Includes the Awesome Oscillator with two vertical lines at a distance of 100 and 140 bars from the last bar to determine the third Elliott wave by the maximum peak of AO in the interval from 100 to 140 bars according to Bill Williams' Profitunity strategy. Additionally, a faster EMA line is displayed.
I also added display of the AO line for the lower timeframe instead of the EMA line if the Moving Average Line values (method, length and source) are equal to the Awesome Oscillator values in the indicator settings. For example, if the chart timeframe is 1 day, then the lower timeframe will automatically be 4 hours, if the chart timeframe is 4 hours, then the lower timeframe will be 1 hour, etc.
VBCHL indicator (Visible bars count on chart + highest/lowest bars, max/min AO)
The indicator displays the number of visible bars on the screen, including the prices of the highest and lowest bars, the maximum or minimum value of the Awesome Oscillator. The values change dynamically when scrolling or changing the scale of the chart, but with a delay of several seconds, so this feature is included in a separate indicator so as not to slow down the work of other indicators.
Indicator settings
In the AFDSA indicator I use the following settings:
By default, the Squat Bar is colored blue, and all other bars are colored to match the Awesome Oscillator color, except for the Fake bars, which are colored with a lighter AO color. But I also enable the display of "Green" Divergent bars in the "Green Bars > Show" field.
I enable the display of Alligator for higher timeframes in the "Alligator for higher timeframe > Enable" field.
In the indicator style settings, I disable the display of the highest and lowest bars, maximum and minimum AO peak labels, because these labels are also displayed by the VBCHL indicator depending on the number of visible bars in the chart window.
Only after opening a position, I enable all additional alerts in the “Enable all additional alerts” field (after changing this field, you need to re-create the alert for the current chart): crossing the green line of an open Alligator, formation of a fractal, appearance of a new maximum or minimum AO peak.
In the settings of the AOE oscillator, I enable the display of the AO line for the lower timeframe instead of the EMA line, setting the same values in the fields for the Moving Average Line (method, length and source) and Awesome Oscillator.
In the VBCHL indicator settings, I only enable the simple display text style for labels in the "Simple display text style for labels" field.
As a result, when analyzing the current chart, I immediately see all the signals on the chart, the location of the bars relative to the Alligator on the higher timeframe and changes in the Awesome Oscillator on the lower timeframe. And thanks to the VBCHL indicator, I quickly select the desired timeframe for analyzing the 5-wave Elliott impulse, focusing on the interval of 140 bars, and immediately see whether there is divergence between the maximum AO peak and the following lower AO peak in this interval.
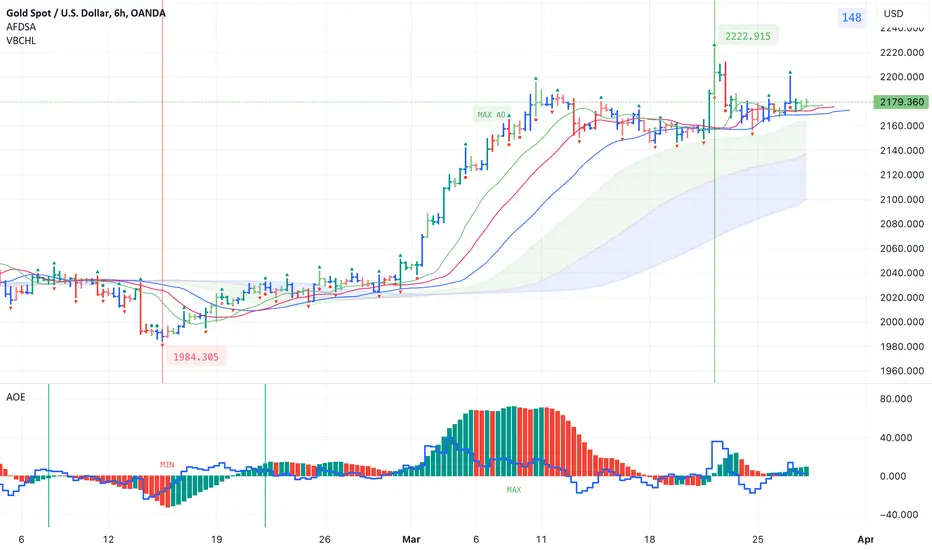
Trend Trading Strategy for the Heiken Ashi Algo v6Knowing when the RSI and price are in a ranging phase even in the short term can be a difficult process.
You are either #Ranging #bullish or #bearish. At least in the Algo v6 you can get a clear vision of exactly whats happening.
In this video im going to give you a VERY simple strategy on:
1. How to know if the RSI and price are ranging
2. When do i break away from Ranges
3. Am I trending
4. Im trending but whats my confluence to take a long or short
5. Is my range getting bigger or smaller
Enjoy this quick vid and ask questions below.
Thanks everyone.

Price overextension: misconceptions and common mistakesPrice overextension remains a widely misunderstood concept in trading, causing both novice and seasoned traders to make errors in their decision-making. This misinterpretation often leads to placing trades in the wrong direction or, equally detrimental, overlooking profitable opportunities.
In essence, price overextension signifies that the market has undergone a rapid and excessive movement in one direction. Such movements are often perceived as unsustainable. Numerous indicators, such as Stochastic, RSI, Bollinger Bands and many other, attempt to identify such "abnormal" price movements so traders could capitalize on them. Despite variations in statistical methods and calculations, their common goal is to detect instances where price went or down too much and is likely to reverse.
In this discussion, I will use Relative-Strength-Index (RSI), a popular indicator, to convey my perspective on price overextension. While some traders argue for customization, the elusive question of "how" often remains unanswered. From my experience, there are no universally perfect settings that consistently yield optimal results.
I’ll draw my examples from the recent SPY bar chart (February 2024).
The first misconception
The first misconception is that if price is overextended it is time to immediately start looking for a trade in the opposite direction. The most important phrase here is “start looking”. Many beginners misinterpret this as an invitation to commence trading, leading to the premature initiation of short positions during perceived market "overextension" and vice versa.
So, the first and foremost important advice is to never try guessing top/bottom based on one indicator or gut feeling. Simple as it seems I remember many times breaking this rule myself because the temptation was too strong. It rarely ended up well.
On the graph, I've highlighted three recent instances where the RSI exceeded 70 (indicating overbought conditions). What stands out is that, following each occurrence, the price surged significantly before consolidation set in, inflicting losses upon short traders.
Even experienced traders, who look for confluence of signals, may fall into this trap. In the first two examples, bearish candlestick patterns failed to prevent subsequent price increases. Most likely, those candles were “created” by weak hands traders, who tried to short market, while it was actually controlled by strong buyers.
These instances could have been avoided by considering the daily graph, revealing a robust bullish context – price was in an uptrend, one-time-framing up on weekly. There were couple of moments when bears gained short term control (Tuesdays 13th and 20th) but they never could take the previous week low; bulls always confirmed their control.
The second advice is to avoid trading against higher level context. While sometimes those trades might work the result is usually mediocre and most of the times you’ll simply lose. If you really wish to trade against context you need to construct a solid dossier of evidence, supporting your trade.
The second misconception
What is the second misconception? It is that when price overextended it is not time to go with the market. In this scenario, traders refrain from initiating long trades after RSI indicates overbought conditions, potentially causing them to miss profitable opportunities. It might not hurt your account but who likes missing good opportunities?
Surprisingly, seizing these trades correctly is not much harder than any other trade. It simply requires prudence and discipline and getting rid-off cognitive biases. For example, in the second example on the graph a trader could win up to 1% if he played off gap-up open after seeing that the new price has found acceptance.
Conclusion
It is possible to build a profitable strategy that relies on “price overextension” concept. However, it demands more than a cursory examination of a single indicator and adherence to textbook candle patterns. Personally, I reached a point where I entirely abandoned the use of RSI and similar tools because, instead of providing clarity, they seemed to cloud my thinking.
Opting for a more effective approach involves keenly observing actual market behavior, which often defies conventional expectations. Study of high-level contexts, understanding key levels, and discerning confluence in price action signals on lower timeframes consistently prove invaluable. This method helps steer clear of common pitfalls and contributes to enhancing overall trading results.

Beating the S&P500 (SPX) Buy&Hold strategy by 16 timesS&P500 (SPX) strategy using Stochastic RSI Min-Max, normalized Volatility and Trailing Stop signals, beats the Buy&Hold strategy by 16 times
Embarking on the quest to time the market accurately, the 'Holy Grail' of strategies, led me to create a script to approach this goal. Unlike other strategies that I tested, this one not only surpasses the long-term S&P500 Buy&Hold approach but does so by a remarkable 16.38 times!
Initially, I employed an A.I. program based on an LSTM Neural Network using TensorFlow. Despite achieving a 55% next-day prediction accuracy for short/long positions, I sought improvement using a heuristic pine-scripting approach, incorporating stochastic RSI oscillators, moving averages, and volatility signals.
With default parameters, this strategy, freely available as "XPloRR S&P500 Stock Market Crash Detection Strategy v2" delivered a staggering 2,663,001% profit since February 1871. In the same period, the Buy&Hold strategy "only" generated 162,599% profit. Picture this: a $1,000 investment in 1871 would now be worth $26,630,014 by February 2024. Check it out for yourself loading this strategy.
The script operates as a Stochastic RSI Min-Max script, automatically generating buy and sell alerts on the S&P500 SPX. What sets it apart? The strategy detects "corrections," minimizes losses using Trailing Stop and Moving Average parameters, and strategically re-enters the market after detecting bottoms using tuned Stochastic RSI signals and normalized Volatility thresholds.
Tailor its parameters to your preference, use it for strategic exits and entries, or stick to the Buy&Hold strategy and start new buy trades at regular intervals using buy signals only. In the pursuit of minimizing losses, the script has learned the effectiveness of a 9% trailing stop on trades. As you can clearly see on the upper graph (revolving around 100), the average overall green surfaces (profits) of all trades are much bigger than the average red surfaces (losses). This follows Warren Buffets first rule of trading to "Never lose money" and thus minimizing losses.
Update: Advanced S&P500 Stochastic RSI Min-Max Buy/Sell Alert Generator
I have also created an Alerter script based on the same engine as this script, which auto-generates buy and sell alert signals (via e-mail, in-app push-notifications, pop-ups etc.).
The script is currently fine-tuned for the S&P500 SPX tracker, but parameters can be fine-tuned upon request for other trackers or stocks.
If you are interested in this alerter-version script or fine-tuning other trackers, please drop me a message or mail xplorr at live dot com.
How to use this Strategy?
Select the SPX (S&P500) graph and set the value to "Day" values (top) and set "Auto Fit Data To Screen" (bottom-right).
Select in the Indicators the "XPloRR S&P500 Stock Market Crash Detection Strategy v2" script and set "Auto Fit Data To Screen" (bottom-right)
Look in the strategy tester overview to optimize the values "Percent Profitable" and "Net Profit" (using the strategy settings icon, you can increase/decrease the parameters).
How to interpret the graphical information?
In the SPX graph, you will see the Buy(Blue) and Sell(Purple) labels created by the strategy.
The green/red graph below shows the accumulated profit/loss in % of to the initial buy value of the trade (it revolves around 100%, 110 means 10% profit, 95 means 5% loss)
The small purple blocks indicate out-of-trade periods
The green graph below the zero line is the stochastic RSI buy signal. You can set a threshold (green horizontal line). The vertical green lines show minima below that threshold and indicate possible buy signals.
The blue graph above the zero line is the normalized volatility signal. You can set a threshold (blue horizontal line) affecting buy signals.
The red graph above the zero line is the slower stochastic RSI sell signal. You can set a threshold (red horizontal line). The red areas indicate values above that threshold.
However real exits are triggered if close values are crossing below the trailing stop value or optionally when the fast moving average crosses under the slow one. The red areas above the threshold are rather indicative to show that the SPX is expensive and not ideal to enter. Please note that in bullish periods the red line and areas can stay at a permanent high value, so it is not ideal to use as a strict sell signal. However, when it drops below zero and the green vertical lines appear, these are strong buy signals together with a high volatility.
These Parameters can be changed
Buy Stochastic Lookback
Buy Stochastic Smoother
Buy Threshold
Buy Only After Fall
Minimum % Fall
Sell Stochastic Lookback
Sell Stochastic Smoother
Sell Threshold
Sell Only With Profit
Minimum % Profit
Use Sell MA
Fast MA Sell
Slow MA Sell
MA Sell Threshold
Use Buy Volatility
Volatility Smoother
Volatility Threshold
Use Trailing Stop
Use ATR (iso of a fixed percentage for the trailing stop)
ATR Lookback
Trailing Stop Factor(or fixed percentage if "use ATR" is false)
Trailing Stop Smoother
Important : optimizing and using these parameters is no guarantee for future winning trades!

2024 US Recession | Key Factors2000 DOT-COM CRISIS
The dot-com crisis, also known as the "dot-com bubble" or "dot-com crash," was a period of economic turbulence that affected the technology and telecommunications sectors in the late 1990s and early 2000s. Here are some key points:
Euphoria Phase: In the 1990s, there was a boom in the technology and dot-com industry fueled by irrational investor euphoria. Many companies secured significant funding, even if they had weak or nonexistent business models.
Excessive Valuations: Valuations of technology companies skyrocketed, often based on exaggerated growth projections and unrealistic expectations. This led to rampant speculation in financial markets.
Bubble and Collapse: In 2000, the dot-com bubble began to burst. Many investors realized that numerous technology companies were unable to generate profits in the short term. This triggered a massive sell-off of stocks and a collapse in tech stock prices.
Economic Impacts: The crisis had widespread economic impacts, with the loss of value in many technology stocks and the bankruptcy of numerous companies. Investors suffered heavy losses, and this had repercussions on the entire stock market.
Economic Lessons: The dot-com crisis led to a reassessment of investment practices and taught lessons about the importance of carefully analyzing companies' fundamentals and avoiding investments based solely on speculative expectations.
Following this crisis, the technology sector experienced a correction but also contributed to shaping the industry in a more sustainable way. Many companies that survived the crisis implemented more realistic and sustainable strategies, contributing to the subsequent growth and development of the technology sector.
2007-2008 FINANCIAL CRISIS
The 2007-2008 financial crisis was a widespread event that had a significant impact on the global economy. Here are some key points:
Origins in the Subprime Mortgage Crisis: The crisis originated in the U.S. real estate sector, particularly in subprime mortgages (high-risk). An increase in mortgage defaults led to severe losses for financial institutions holding securities tied to these loans.
Spread of Financial Problems: Losses in the mortgage sector spread globally, involving international financial institutions. Lack of transparency in complex financial products contributed to the crisis's diffusion.
Bank Failures and Government Bailouts: Several major financial institutions either failed or were on the brink of failure. Government interventions, including bailouts and nationalizations, were necessary to prevent the collapse of the financial system.
Stock Market Crashes: Global stock markets experienced significant crashes. Investors lost confidence in financial institutions, leading to a flight from risk and an economic contraction.
Impact on the Real Economy: The financial crisis directly impacted the real economy. The ensuing global recession resulted in the loss of millions of jobs, decreased industrial production, and a contraction in consumer spending.
Financial Sector Reforms: The crisis prompted a reevaluation of financial regulations. In response, many nations implemented reforms to enhance financial oversight and mitigate systemic risks.
Lessons Learned: The financial crisis underscored the need for more effective risk management, increased transparency in financial markets, and better monitoring of financial institutions.
The 2007-2008 financial crisis had a lasting impact on the approach to economic and financial policies, leading to greater awareness of systemic risks and the adoption of measures to prevent future crises.
2019 PRE COVID
In 2019, I closely observed a significant event in the financial markets: the inversion of the yield curve, with 3-month yields surpassing those at 2, 5, and 10 years. This phenomenon, known as an inverted yield curve, is generally considered an advanced signal of a potential economic recession and has often been linked to various financial crises in the past. The inversion of the yield curve occurred when short-term government bond yields, such as those at 3 months, exceeded those at long-term, like 2, 5, and 10 years. This situation raised concerns among investors and analysts, as historically, similar inversions have been followed by periods of economic contraction. Subsequently, in 2020, the COVID-19 pandemic occurred, originating in late 2019 in the city of Wuhan, Hubei province, China. The virus was identified as a new strain of coronavirus, known as SARS-CoV-2. The global spread of the virus was rapid throughout 2020, causing a worldwide pandemic. Countries worldwide implemented lockdown and social distancing measures to contain the virus's spread. The economic impact of the pandemic was significant globally, with sectors such as tourism, aviation, and hospitality particularly affected, leading to business closures and job losses. Efforts to develop a vaccine for COVID-19 were intense, and in 2020, several vaccines were approved, contributing to efforts to contain the virus's spread. In 2021, the Delta variant of the virus emerged as a highly transmissible variant, leading to new increases in cases in many regions worldwide. Subsequent variants continued to impact pandemic management. Government and health authorities' responses varied from country to country, with measures ranging from lockdowns and mass vaccinations to specific crisis management strategies. The pandemic highlighted the need for international cooperation, robust healthcare systems, and global preparedness to address future pandemics. In summary, the observation of the yield curve inversion in 2019 served as a predictive element, suggesting imminent economic challenges, and the subsequent pandemic confirmed the complexity and interconnectedness of factors influencing global economic health.
2024 Outlook
The outlook for 2024 presents significant economic challenges, outlined by a series of critical indicators. At the core of these dynamics are the interest rates, which have reached exceptionally high levels, fueling an atmosphere of uncertainty and impacting access to credit and spending by businesses and consumers. One of the primary concerns is the inversion of the yield curve, manifested between July and September 2022. This phenomenon, often associated with periods of economic recession, has heightened alarm about the stability of the economic environment. The upward break of the 3-month curve compared to the 2, 5, 10, and 30-year curves has raised questions about the future trajectory of the economy. Simultaneously, housing prices in the United States have reached historic highs, raising concerns about a potential real estate bubble. This situation prompts questions about the sustainability of the real estate market and the risks associated with a potential collapse in housing prices. Geopolitical instability further contributes to the complexity of the economic landscape. With ongoing conflicts in Russia, the Red Sea, Palestine, and escalating tensions in Taiwan, investors are compelled to assess the potential impact of these events on global economic stability. The S&P/Experian Consumer Credit Default Composite Index, showing an upward trend since December 2021, suggests an increase in financial difficulties among consumers. Similarly, the charge-off rate on credit card loans for all commercial banks, increasing since the first quarter of 2022, reflects growing financial pressure on consumers and the banking sector. In this context, it is essential to adopt a prudent approach based on a detailed analysis of economic and financial data. The ability to adapt to changing market conditions becomes crucial for individuals, businesses, and financial institutions. Continuous monitoring of the evolution of economic and geopolitical indicators will be decisive in understanding and addressing the challenges that 2024 may bring.

How RSI Alerts Can Supercharge Your Long-Term Crypto PortfolioBuilding a long-term portfolio demands a strategic approach that goes beyond random buys and impulsive decisions.
Instead, savvy investors employ tools like the Relative Strength Index (RSI) to identify advantageous entry points and navigate the market cycles effectively.
💜 If you appreciate our guides, support us with boost button 💜
Here’s a step-by-step guide on how to harness RSI alerts to fortify your long-term crypto holdings.
Step 1: Spotting Entry Opportunities with RSI < 35
When aiming for long-term crypto accumulation, the goal is to buy assets at opportune prices. Setting up your charts with the RSI indicator and adjusting the lower band to 35 enables you to pinpoint instances where cryptocurrencies in your portfolio might have experienced an unwarranted dip. This can be a golden opportunity to acquire assets for the long run, aligning with the principle of buying low.
Step 2: Steering Clear of Overbought Zones with RSI > 70
Conversely, an RSI reading surpassing 70 signals potential overbought conditions. In such instances, it's prudent to exercise caution. Holding off on new purchases during these periods or even considering exiting certain positions that have seen significant price surges allows you to safeguard your returns. Converting gains into stablecoins during overbought phases enhances liquidity, positioning you strategically for future opportunities.
Step 3: Confirm with Other Indicators & DYOR
RSI functions most effectively when complemented by other indicators. Incorporating tools like Moving Averages, Bollinger Bands, and MACD provides a more comprehensive view of market conditions. Remember, thorough research is crucial. Rely on multiple indicators to reinforce your decision-making process and mitigate risks associated with single-point analyses.
Step 4: Get Timely RSI Alerts On Your Email & TradingView App
Time is of the essence in the volatile crypto market. Instead of constantly monitoring prices across various platforms, set up RSI alerts on TradingView to receive timely notifications. This ensures you don’t miss critical market movements and can respond promptly to favorable conditions or potential risks.
How to Create RSI Alerts on TradingView
Open TradingView: Log in to your TradingView account.
Select the Chart: Open the chart of the cryptocurrency you're monitoring.
Add RSI Indicator: Click on "Indicators" at the top, search for RSI "Relative Strength Index", and add it to your chart.
Set RSI Levels: Adjust RSI levels by clicking on the RSI label on the chart, then edit the Upper and Lower Band levels to your preferred values (e.g., 35 for Lower Band, 70 for Upper Band).
Create Alert: Click on the alarm bell icon at the top of the chart, then select "Add Alert." Choose the condition (crossing above/below RSI level), set the desired RSI level, and customize the notification settings.
Save Alert: Confirm and save your alert. You’ll now receive notifications via email or within the TradingView platform when the specified RSI conditions are met.
Effectively utilizing RSI alerts is a game-changer for long-term crypto investors. By intelligently identifying entry points, avoiding overbought conditions, confirming signals with other indicators, and staying informed with timely alerts, you position yourself for success in the dynamic world of cryptocurrencies. Enhance your portfolio strategy with RSI – a tool that brings precision and efficiency to your crypto investment journey.

Tips on Adjusting the RSI (Part 2) Although the standard setting for the RSI is 70 (overbought) and 30 (oversold), I prefer to adjust the levels to 80 and 20. The purpose of this is to identify the extremely overbought/oversold regions.
In addition to adjusting the levels, I would pay attention to the chart when the RSI enters in the overbought/oversold region (but would hold back on entering a trade)
I would only enter a trade when the RSI turns down/up from the overbought/oversold region.
This would signal that the price is likely to fall/rise as the RSI reverses from the extremes and back within range.

Learning to use the RSI (Part 1)The Relative Strength Index (RSI) is a popular momentum oscillator used in technical analysis to identify overbought or oversold conditions in the market. The RSI is measured on a scale from 0 to 100,
RSI values above 70 are often considered overbought, suggesting that the price may be due for a reversal or pullback.
RSI values below 30 are often considered oversold, indicating that the price may be due for a bounce or recovery.
A common mistake most traders will make is to assume that once RSI signals an overbought/oversold condition, the price should drop/rise, hence leading to a sell/buy decision.
In the 2 examples highlighted (solid blue lines), you will notice that although RSI signaled an overbought/oversold condition, the price continued to climb/drop despite being overbought/oversold.
Remember: Prices can be overbought/oversold for an extended period of time
When using any indicator, always remind yourself of what it is measuring and remember that it is just math (not magic). The indicator is supposed to help quantify and help you see things clearer on the chart (rather than numbers).
Check out Part 2 for Tips on Adjusting the RSI

Super Swing Strategy - Bollinger Bands, RSI, and ADX Strategy"Super Swing Strategy" - Bollinger Bands, RSI, and ADX Strategy
Indicators Used:
- Bollinger Bands
- Relative Strength Index (RSI)
- Average Directional Index (ADX)
Bollinger Bands for volatility, RSI for overbought and oversold conditions, and ADX for strength of the trend.
How it Works:
Add Bollinger Bands, a 14-period RSI, and a 14-period ADX to your chart.
When the price touches the upper Bollinger Band, the RSI shows overbought conditions (above 70), and the ADX is above 20, it's a potential bearish signal.
A bullish signal occurs when the price touches the lower Bollinger Band, the RSI shows oversold conditions (below 30), and the ADX is above 20.
You can use additional indicators or price action analysis to confirm signals.

Stock HeatmapHave you ever heard of a stock heatmap? 📈 It's an innovative and visually appealing tool used in the world of finance to analyze and interpret market data. Let's explore what it is and how it can be useful in your trading journey.
🌡️ What is a Stock Heatmap?
A stock heatmap is a graphical representation of a large set of stocks or securities, where each individual stock is color-coded based on its performance or specific metrics. It provides a visual snapshot of the entire market or a specific sector, helping traders quickly identify trends, strengths, and weaknesses.
🔍 Utilizing Heatmaps
1️⃣ Market Analysis: Heatmaps allow you to assess the overall market sentiment and identify which stocks are performing well and which ones are underperforming.
2️⃣ Sector Analysis: By using sector-specific heatmaps, you can easily spot strong sectors and weak sectors, helping you make informed decisions about sector rotation strategies.
3️⃣ Stock Selection: Heatmaps can assist in narrowing down potential trading opportunities by highlighting stocks with significant price movements, volume surges, or specific technical indicators.
4️⃣ Risk Management: Heatmaps help you assess the risk-reward profile of different stocks, enabling you to prioritize stocks that align with your risk tolerance and investment goals.
Remember, a stock heatmap should be used as a complementary tool alongside other fundamental and technical analysis techniques. It provides a dynamic and intuitive way to visualize market data, aiding in decision-making and identifying potential trading opportunities.

Mastering the VIX on TradingViewThe VIX, also known as the CBOE Volatility Index, is a widely-used financial instrument used to measure market volatility and investor sentiment. In this article, we will explore how to use the VIX on TradingView to improve your trading strategies.
Before we dive into how to use the VIX, let's first understand what it is and how it works. The VIX is based on the S&P 500 index options, and measures the implied volatility of those options over the next 30 days. Essentially, the VIX provides a gauge of how much the market is expected to move over the next month.
Now, let's discuss how to use the VIX on TradingView. To begin, open up the TradingView platform and search for the VIX symbol, which is typically denoted as VIX. Once you have located the VIX, add it to your watchlist and open up the chart.
On the chart, you will notice that the VIX moves inversely to the S&P 500. When the S&P 500 goes down, the VIX goes up, indicating that market volatility is increasing. Conversely, when the S&P 500 goes up, the VIX goes down, indicating that market volatility is decreasing.
So how can we use the VIX to improve our trading strategies? One strategy is to use the VIX as a hedging tool. For example, if you have a portfolio of stocks and are concerned about a potential market downturn, you could buy the VIX to protect yourself against losses. This is because the VIX tends to increase in value when the market is experiencing volatility.
Another way to use the VIX is as a contrarian indicator. When the VIX is at a very low level, it may indicate that investors are overly complacent and that the market may be due for a correction. On the other hand, when the VIX is at a very high level, it may indicate that investors are overly fearful and that the market may be due for a rebound.
In conclusion, the VIX is a powerful tool that can be used to measure market volatility and investor sentiment. By understanding how the VIX works and using it in conjunction with other technical indicators, you can improve your trading strategies and better navigate the unpredictable world of finance. Remember, always do your own research and consult with a financial advisor before making any investment decisions.

Relative Strength Index/RSI Made SimpleThe RSI (Relative Strength Index) is like a tool that helps people who buy and sell stocks and other things to figure out how strong the price of something is. It works by looking at the prices of that thing over a certain period of time, like 14 days, and then putting those prices on a scale from 0 to 100.
🔸When the RSI is high, like over 70, it means the price has gone up a lot and might be too high. When the RSI is low, like under 30, it means the price has gone down a lot and might be too low.
But just looking at the RSI by itself is not enough.
While many traders do use the RSI to buy at the 30 level and sell above the 70 level, this is not the only way to use the indicator. (As shown below)
🔸The RSI should be used in conjunction with other technical indicators and fundamental analysis to make informed trading decisions. In fact, relying solely on these levels can lead to missed opportunities and suboptimal trading decisions.
🔸It's also worth noting that the RSI can be used to identify bullish and bearish trends. When the RSI is above 50, it is considered bullish, indicating that the market is trending upwards. When the RSI is below 50, it is considered bearish, indicating that the market is trending downwards.
🔸While the 70 and 30 levels are popular levels to buy and sell, traders can also use other points based on how price reacts at those levels. For example, if the RSI reaches 80, it may indicate an especially strong upward trend, while a drop to 20 may indicate an especially strong downward trend. Traders should use their own judgment and analysis to determine which levels are most appropriate for their trading strategy. You can also find that as the name suggest (Relative Strength) traders should look for levels in price action where there is a strong reaction and then check to see at what level on the RSI this occurred because it might happen again once we got to that RSI value. (As seen below )
So as you can see in the image above you do not need to wait for price to go to levels 80 or 20 in order to look for reactions you can look at how price has reacted at previous levels before and monitor those levels in the future.
Finally lets talk about divergence.
🔸RSI divergence is a trading strategy that involves looking for differences between the movement of the price of an asset and the movement of the RSI indicator.
When there is RSI divergence, it means that the price of an asset is moving in a different direction than the RSI indicator, which can signal a potential change in trend.
There are two types of RSI divergence: bullish and bearish. Bullish divergence occurs when the price of an asset is making lower lows, but the RSI indicator is making higher lows. This can suggest that the price of the asset is oversold and may be due for a rebound.
Conversely, bearish divergence occurs when the price of an asset is making higher highs, but the RSI indicator is making lower highs. This can suggest that the price of the asset is overbought and may be due for a correction.
Traders can use RSI divergence to help them make trading decisions. For example, if they see bullish divergence, they may consider buying the asset, while if they see bearish divergence, they may consider selling the asset. However, traders should always use RSI divergence in conjunction with other technical indicators and fundamental analysis to make informed trading decisions.
Example is shown below:
🔸Settings of the RSI:
Traders can customize the settings of the RSI to suit their trading style and preferences. They can adjust the number of periods used in the calculation, which can range from as low as 2 to as high as 200 or more, depending on the timeframe being analyzed.
In addition to the default settings, traders can also adjust the overbought and oversold levels of the RSI. By default, the RSI is considered overbought when it is above 70 and oversold when it is below 30. Traders can adjust these levels to suit their trading style and the specific asset being analyzed.
Traders can also add other indicators on top of the RSI to help them analyze the market. For example, they may add a moving average to the RSI to help them identify trend direction and potential areas of support and resistance.
______________________________________________
Also keep in mind that the RSI can be used as a reversal tool and also a trend trading tool. For example, when the RSI reaches extreme levels of overbought or oversold, it can signal a potential reversal in the price trend. When the RSI reaches these levels, traders can look for other confirming indicators or price action to help them decide whether to enter a trade in the opposite direction.
On the other hand, as a trend trading tool, traders can use the RSI to identify the strength of a trend and to help them decide when to enter or exit a trade. When the RSI is above 50, it can indicate a bullish trend, and when it is below 50, it can indicate a bearish trend. Traders can use the RSI to help them identify potential areas of support and resistance within the trend and to enter trades in the direction of the trend.
It's important to note that traders should not rely solely on the RSI to make trading decisions. The RSI should be used in conjunction with other technical indicators, such as moving averages, and fundamental analysis to get a complete picture of the market. By using the RSI as both a reversal tool and a trend trading tool, traders can better identify potential trading opportunities and make more informed trading decisions.

DAY TRADING 101: How to Get StartedHello guys! Day trading is a popular way for traders to make money by buying and selling assets within the same trading day. However, before you begin day trading, it's important to understand the basics and develop a solid trading strategy. In this post, we'll cover the basics of day trading and provide some tips on how to get started.
First, it's important to understand the different types of securities that you can day trade. Some popular options include stocks, options, futures, and currencies. Each of these securities has its own unique characteristics and requires different strategies, so it's important to choose the one that best fits your goals and risk tolerance.
Next, you need to develop a trading plan . Your plan should include your trading strategy, the securities you plan to trade, and your risk management techniques. It's also important to set realistic goals and be prepared to stick to them.
Once you have a trading plan in place, you need to practice . You can do this by using a simulation or paper trading account. This will allow you to test your trading strategy and learn from your mistakes before you start risking real money.
Another important thing to consider is your risk management . This means understanding the level of risk you're willing to take and setting stop-losses and profit-taking orders to protect your capital. It's also important to maintain a proper risk-reward ratio, which means that the potential profit should be larger than the potential loss.
In addition to the above, it's crucial to keep an eye on the market and news , as they can greatly impact your trades, so it's essential to stay updated with the latest news and trends. Finally, keep in mind that day trading requires discipline and patience, so be prepared to put in the time and effort to become a successful trader.
To sum it up, day trading can be a great way to make money, but it's important to understand the basics and develop a solid trading strategy. Additionally, you should practice with a simulation or paper trading account, have a proper risk management, stay informed and be prepared to put in the time and effort.
Which type of trading do you prefer?

bullish vs bearish conditions for spxspx could have bull or bear technical numbers on my chart depending on the path these indicators take. if they go up with the price thats bullish, and if they move lower with the price thats bearish. im bearish on touches of the upper levels marked out as the index rises or breaks of lower levels while it sinks, and im bullish on support from lower levels or breaks of higher levels if the index bounces. pivot around low anchored vwap. anchor vwap to top for dips, and bottom for rips.

🔍What you need to know about the DXY index🤔🔍 DXY INDEX (USDX) displays the value of USD against a basket of six foreign currencies: EUR, JPY, GBP, CAD, SEK, CHF.
This index is calculated on the basis of the weighted average ratio of USD to six currencies.
➡️ EUR —> 57,6%
➡️ JPY —> 13,6%
➡️ GBP —> 11,9%
➡️ CAD —> 9,1%
➡️ SEK —> 4,2%
➡️ CHF —> 3,6%
➖➖➖➖➖➖➖➖➖➖➖➖➖➖➖➖➖➖➖➖➖➖➖➖➖➖➖➖➖➖➖➖➖➖➖
❗️ Interesting note ❗️
Given the fact that the EUR is included in the DXY (the largest weight in the index, so it is not surprising that the DXY and EURUSD are highly correlated), the dollar index is the currency of the member countries of the EUR zone.
➖➖➖➖➖➖➖➖➖➖➖➖➖➖➖➖➖➖➖➖➖➖➖➖➖➖➖➖➖➖➖➖➖➖➖
The index was created by JPMorgan Chase, which officially released this trading instrument to the market in 1973. The level of 100 was taken as the base value. The index was not subject to any changes, except for the introduction of EUR in Europe.
DXY allows you to form an idea of the value of the USD and its weight in the world. In addition, this index may signal a recession in the world: the rapid growth of DXY indicates that market participants prefer to withdraw their investments in cash, i.e. in USD, and in moments of economic instability, buy US bonds with these USD.
🔴 Thus, the index is used as a separate speculative trading instrument in the market, and also serves as an indicator that allows you to determine current financial trends.
