Complete Macro AnalysisHello everybody! This is a follow up on my 6-part traditional and crypto market analysis, yet everyone that reads this one will benefit greatly, regardless of whether they've read any of the previous analyses or not. Over the last week I provided some updates on each part, however it currently makes more sense for me to make a brand-new holistic analysis, rather than provide small updates on each part. This one will be focused entirely on traditional markets, while the next one will be focused entirely on crypto.
In order for anyone to have a better idea of where markets might be headed next, it is best to start with the bond market. Bond yields have been rising across the world and across the entire curve, with the big distinction that lower duration bond yields have been rising significantly faster than long term ones. The main reason that this is happening is that bond markets are expecting Central banks to raise rates a few times in the next 1-2 years, but don't believe they can do anything more than that. Essentially the market sees inflation being transitory, that the global economy is in a bad shape and that Central banks are in such a terrible spot, that by the time they raise rates a few times, they will be forced to start cutting them again.
Based on the charts below, it is clear that bond yields are still in a massive downtrend. The 10y yields have started hitting resistance, while yesterday we got the first rejection at resistance due to the Russia/Ukraine news. It is pretty normal for people to seek safety at times like this, by buying bonds (bond yields and bonds are inversely correlated). So, as you can see on the third chart, the minute bonds got to support and the news started coming out, the bond market bounced. Although I wish that war between Russia and Ukraine doesn't happen, and actually believe it won't happen, in case that it does happens, the Fed gets some room to not raise rates. For many reasons that I mentioned in the previous analysis, it is clear that inflation will come down significantly in 2022 and there is very little the Fed could do about it anyways. Therefore, any excuse they might be able to use to not raise, they will probably use it. Having said all that, bonds are still in a short to medium term bear market, and could fall another 5-10% before they put in a final bottom (yields going up by 0.5-1% from here).
Now the situation between Russia and Ukraine doesn't affect markets just because it affects the psychology of people or because governments print money to cover expenses of war. There are several severe implications around trade and resources, as a lot of trade especially between Europe and Russia could stop, while Russia is a major exporter of commodities, primarily of Oil and Natural Gas. Europe and the entire world were already facing serious problems around energy, and this could make things even worse. Again, for many reasons mentioned in the previous analysis, there isn't enough oil above ground or oil production to cover the needs of the world at reasonable prices. OPEC isn't even able to meet its production increase goals, let alone be able to handle Russia not giving oil to the rest of the world. Oil is already pretty expensive relative to where it should be given the current state of the global economy, and based on the charts it could go significantly higher. So far, the market has behaved as I had expected, with a rise up to 92-93$, a pullback and now another push higher. It's not yet clear if the current situation will boost oil prices above 100$, but it is certainly possible. In the short term it is easy to see a mini 'speculative shock', that could send crude up to 115-120$, only for it to then come all the way down to 75$ and find support there.
What is interesting to note is how Gold has been able to hold its ground for so long, despite bond yields going higher. Not only that, but it currently sits above all major moving averages and pivots, while it has also broken above its key diagonal resistance. The truth is that the breakout isn't as decisive as one might have expected based on the news that came out on Friday, hence it might be a trap. It’s clear that the breakout was heavily affected by the the Russia/Ukraine news and that could be the catalyst for a gold bull market, but it’s still prudent to be cautious. What is even more interesting is that Gold has gone up, while most Central banks are raising or plan to raise rates, and while the USD has been going up since early 2021. In my previous analysis, I mentioned how I thought gold going up or down is more like a coin toss, as there is a strong case to be made in either direction. Some people took that as me being bearish on Gold, while what I had said was that above 1930-1940 gold might be tremendous for going long. Personally I prefer to buy strength and simply sacrifice some gains, in order to avoid being stuck in a trade that doesn't do well.
A few weeks ago, the ECB hadn't even talked about raising rates, but now they have. Right after the Fed meeting the EURUSD pair had a major reversal that accelerated when the ECB started turning hawkish. My initial thought was to watch Gold closely, as now 3 of the 5 major Central banks are raising or talking about raising rates, yet gold remains strong. At the moment EURUSD has been rejected at resistance with an SFP, yet it still has some room to the upside. It's above the 50 DMA and the diagonal, so if everything goes well and tensions get resolved peacefully, the pair could easily get to 1.15-1.17 by the next Fed meeting. The USD seems to already been losing steam as the yield curve is flattening and there are already 7 rate hikes being priced in. Hence the ‘real’ news isn’t that the Fed will raise rates by 0.25% in an emergency meeting or that it will raise rates by 0.5%, but that the ECB might raise rates after an entire decade, as well as that all Central banks will be forced to cut rates relatively soon.
Therefore, this gold strength could also be an indication that many investors are betting on a policy error by Central banks, which might be forced to reverse course faster than people expect. What people need to know, is that gold doesn't behave like most people think it does. Gold in our age, is more like an error/catastrophe hedge, that tends to follow real rates. For example, today Gold could benefit from two things: 1. A war is definitely a big boost for gold, as people might want to own it because it is of limited supply and has no counterparty risk, and it can easily be owned anywhere. Countries that go to war tend to devalue their currency or even seize assets, or that country itself could be excluded from the global financial system, like being kicked out of the SWIFT system. In such a situation gold tends to offer tremendous certainty, while nothing else really does, not even US treasuries. 2. When Central banks are cornered or have no real control over a certain situation. Currently it is obvious that Central banks are trapped, and that there is another major 'catastrophe' lying ahead. The world is stuck in an environment of low growth and too much debt, with markets being significantly overleveraged. None of the problems over the last 20-30 years have been solved, only papered over, hoping that the system magically heals, with the last 13 years alone being full of examples of them always acting late. Finally, the key reasons why gold hasn't done well during a situation of deeply negative interest rates, is that 1. Gold had rallied significantly since 2018, 2. There were lots of different, more compelling opportunities out there, 3. Everyone was already prepared (nobody else to buy + people had to sell gold as inflation increased to covered other costs, essentially using their insurance), 4. Most of the inflation wasn't caused by the Fed / Central bank actions.
After having gone through all of the above, it is definitely time to talk about stocks. Once again I’ll focus on the top 3 US indices, SPX, NDX and RUT, as they can give us a pretty good idea of where stocks are headed globally. In my previous analysis I mentioned how I expected a bounce, a dip and then another bounce, which all pretty much played out based on my technical analysis, with one exception. The last move up was shorter than initially expected, however even based on my tools I was probably 'too optimistic'.
Starting with the S&P 500, we can see how the bullish channel was broken and significant downside followed. Then the market had a strong bounce off the 300 DMA + horizontal support. After the bounce it got rejected on the 100 DMA + diagonal resistance + horizontal resistance, and fell down to the 200 DMA where it bounced. What is odd to me is that the bounce ended with a double top, rather than getting up to the 50 DMA and test the diagonal, while forming an SFP. A double top there is somewhat bullish in the short term, as it is an area that the market will probably break before making new lows. At the moment the market is sitting right at the Yearly Pivot but has broken below the 200 DMA, a situation that is neither very bullish or bearish. As a whole the momentum is indeed pointing lower and this isn't a great picture.
In turn the Nasdaq 100 is actually looking much worse than the S&P 500, as a lot of the big tech behemoths have been taking several big hits recently. Slow growth, higher inflation and higher interest rates, are definitely not beneficial for these companies. For example, we saw a massive gap down for Facebook after a disappointing earnings report, a gap similar to what happened in June 2018, with the NDX going down 19% from that point in the next 6 months. Tech stocks have massively outperformed everything else since 2009, and pretty much everything compared to where they were in Feb 2020, so it is normal to get some extra weakness in this index. At the same time several parts of the stock market started peaking throughout 2021, with mid Feb 2021 being a major inflection point. At that time many unprofitable tech related companies had reached bubble territory and started reversing, but the effects of their valuation getting crushed started having an impact on NDX three months ago.
The third index and final index is the Russell 2000, which looks like it was in distribution for about 10 months, while a few days ago it had a throw back into resistance. The RUT had a really strong breakout in Nov 2020 and by March 2021 it was up 35%. Then in September it formed a clear bull trap that led to the major leg down. Once the 2100 support that was tested multiple times for about a year was broken, it became clear that more downside would soon follow. At the time of my previous analysis, I mentioned that we'd probably see the Russell retest that support and flip it into resistance, which happened as expected. Now the index is below all major moving averages and Pivots, and is still looking bearish, even though in the short term it has shown a decent amount of strength. Until it reclaims 2250, it remains in bearish territory and it is probably best to avoid going long,
Based on all the above, things overall aren't looking great. At least not in the short to medium term, for the economy and the stock market. Central banks are trapped and most investors are aware of that, and now there is an extra variable, that of the conflict. So the question then becomes, if everyone is aware of all of this, couldn't the market simply go up from here? Aren't lots of these things priced in? Aren't wars said to be good for the stock market? Well, like I mentioned above all of these are correct. It is true that due to the conflict we might see bond yields roll over and we get more stimulus from central banks and governments, both of which could push stocks higher. However, in the short term there is a lot of uncertainty due to the way many things will get disrupted in the world. Because of that gold and oil could go ballistic, hence they are the best bets at the moment. It is probably best to stay away from stocks for now, as their potential downside is substantial, while their potential upside is limited as they need some time to recover. Nothing in the charts really suggest that they are ready to go up hard any time soon. Let's also not forget that stocks would have eventually deflated to an extend, regardless of what the Fed or what happens in the world, as the 2020-2021 frenzy couldn't last forever. Of course this doesn't mean that I believe a major bear market is in play right now, just that the SPX could eventually get to 3900-4000 in the next year, that the NDX will test its major log diagonal and that the RUT will its 2018 highs. Although I don't know how or when we get there, to me the most likely scenario is that within the next 2 years bond yields will collapse and the government will be forced to spend a lot, while the Fed is forced to cut rates and do QE. Even if the yields don't collapse and inflation goes rampant, the US government will still be forced to print and spend a lot, something that would make the problems worse.
In conclusion, despite the fact that I was mostly bullish on stocks and oil through 2020-2021 and neutral-bearish on gold, my stance now remains bullish on oil (buying dips anywhere from 55-75$), neutral-bullish on gold and neutral-bearish on stocks. For me to turn bullish on stocks again, I'd either need to see certain levels get to the downside or reclaim certain levels to the upside, or some extreme action by central banks or governments. In terms of US bonds and the US Dollar, the picture is not as clear. In early 2021 I was bearish on bonds, but after that I was bullish as I didn't really expect the Fed to raise rates and thought bonds were significantly oversold. Even if I wasn't expecting the Fed to raise rates, the USD was also extremely oversold and none of the issues of the financial system had been solved. The world was still short on dollars, what the Fed and the government did was too little and at the same time everyone printed. In the current environment, on the one hand bonds are in major downtrend and the USD is in a major uptrend, and on the other hand both might have reversed after hitting major inflection points. Hence it is probably better to either go with the trend or simply wait a bit until the market gives us a clearer picture as to where it wants to go next.
Thanks a lot for reading and good luck with your trading! :)
SPX (S&P 500 Index)

Using different deflactors on IndexesHere I put up a series of deflactors on the Nasdaq 100 Total Return...
I like to use Total Return Indexes becuase they acurately reflect the actual growth of the invested money, rather than simple price indexes... I picked the Nasdaq because as you may have noticed from previous posts the Nasdaq is the absolute winner in terms of performance in the last 15 years... also (unfortunately) I did not find a Total Return option for the S&P500 on Tradingview... actually it's quite bad out there, even spglobal.com doesn't seem to publish those anymore, much less deflated with CPI...
Anyway, moving to the chart here we present a series of deflactors applied to the $NDX Total Return since INCEPTION:
1. Gold
2. CPI
3. CPI+DXY
4. M2 (Fred money stock)
5. REAL M2 (Fred money stock with CPI)
I found the Real M2 the most interesting idea, for in a high monetary inflation environment, Real M2, purges the nominal M2 (total monetary inflation) of its price inflation "component", and comes to a somehwat more balanced deflaction than the original metric (435% performance using M2 Real, vs 275% using the Pure M2 deflactor)

Big Four Macro Overview: Part 5For more detail please refer to the first four pieces in the series (linked below) and the accompanying charts.
Markets entered 2022 with well established trends and trading ranges, but I believe that the coming year holds significant potential for change. This is particularly true in the equity and treasury markets. Because much of the outlook hinges on inflation (see below) it will be particularly important to monitor inflation related markets.
Importantly, while it's easy to make the case that rates should rise significantly this year, modern financial history suggests that rising rates are likely to break the most vulnerable financial link. If that link has the ability to create systemic disruption, rates will fall again, even if inflation is high, as the market runs to the quality of treasuries.
In my opinion, the most important trend of the last four decades has been the decline and subsequent quiescence in the inflation rate. Falling and low inflation allowed Treasury rates to decline. Falling Treasury rates supported equity valuations and home prices. They also enabled the wholesale financialization of the economy and allowed both public and private entities to add leverage without consequence. Importantly low and steady inflation also created the negative correlation between treasury and equity. Without that correlation 60/40 and risk parity strategies may well be in danger.
Inflation: My working thesis has been that many of the trends that supported disinflation have reversed and that rising inflation will act as a headwind to investment for the next decade. Going into 2020 I believed that the stage for higher inflation had already been set and that higher inflation would result in higher rates and ultimately equities.
Consider that in early 2020:
• The output gap had closed for the first time since the Great Financial Crisis.
• The economy had just reached full employment with a U-3 Unemployment rate @ 3.5%.
• Wages as measured by the Employment Cost Index were rising @ +4.4% YOY rate.
• The Cleveland Fed Median CPI had recently set a 10 year high.
If not for the pandemic, by early 2021. the Federal Reserve would have been forced to respond to rising inflation by increasing rates. Instead, Covid crushed the demand side of the economy, derailing the growing inflation. Now the extreme fiscal and monetary response combined with disruptions in logistics and labor have combined to create very high inflation. While I think that many of the issues creating this burst of inflation are moderating, the same set of factors that were reversing in 2020 are still in place. In short, I believe that the broader trend has changed and that when everything settles out, will end up significantly in excess of the Feds 2% average target.
Bottom Line: Above trend growth in inflation and monetary/fiscal tightening suggest higher volatility and a significant chance that many of the trends that have defined the last few decades will falter. My sense of the economy is that the best growth has already occurred as the result of historically supportive fiscal and monetary policies and now both paths are turning restrictive (see the second part of this series for a more in depth discussion) and markets will likely reflect that reality.
Rates:
• Bonds remain in a bull market defined by a broad declining channel, but rising inflation could easily change the trend. The most likely catalyst to end keep rates below 3.25% would be a financial accident created by higher rates.
Equities:
• SPX remains in a technical bull market and there are no overtly bearish behaviors evident in the longest perspectives. However short term weakness can easily morph into a bear market.
Commodities:
• Goldman Sachs Commodities index is in the center of a broad 14 year range, bounded essentially by the low set during the financial crisis and the resultant 2011 high. range. The most notable/useful current chart feature is the clear uptrend from the 2020 pandemic low. Until that uptrend is broken, the most immediate trend is to higher prices.
US Dollar:
• The wide macro range, 70.70 - 121.02 has contained price action over most of my trading career but volatility is more cyclical than price. These periods of low vol. set up conditions that often lead to explosive moves.
Now, back to the charts!
Good Trading:
Stewart Taylor, CMT
Chartered Market Technician
Shared content and posted charts are intended to be used for informational and educational purposes only. The CMT Association does not offer, and this information shall not be understood or construed as, financial advice or investment recommendations. The information provided is not a substitute for advice from an investment professional. The CMT Association does not accept liability for any financial loss or damage our audience may incur.

The Investor Mentality: Are You a Worthy Investor?There are two types of people: people who will read through this entire post and put themselves on a life-changing path towards generational wealth by understanding the essence of investing, and people who simply won't read this post. This post may be lengthy and abstract, but I guarantee you that comprehending the concept of what it means to invest, and how to do so, can change your life forever.
This is not financial advice. This is for educational purposes only.
Capitalism is much simpler than you think. The goal of the game, as the name suggests, is accumulating as much capital as possible. Interestingly enough, there are only three ways to achieve this goal, and if anyone tells you otherwise, they're either lying or they're a crook. The method is simple - you need to own the three means of production: land, labor, and capital.
Land: Only 30% of earth's surface is covered by land. Land, contrary to common belief, is rare in the sense that it's limited. If you own land, you can have factories and houses built on your land, through which you can receive rent. This was also prevalent in the past where aristocrats allowed peasants to farm on their properties, taking a certain percentage of the crops that were harvested without even breaking a sweat.
Labor: When you own labor as a means of production, it essentially means that you run a business. What this implies might not be intuitive, but it simply means that you're paying money to buy someone's time. Time is a resource that is much more important than money. Money is infinite, and can even be printed. As for time, both Jeff Bezos and a freshman at college both get 24 hours a day. The difference between the two, is that Jeff Bezos can pay the freshman and hire him to work on whatever needs to be done. Essentially, Jeff is paying to buy the freshman's time, a limited resource.
Capital: Capital is the magic sauce that allows all of this to happen. You can buy land, buy someone else's time, and even buy companies that do all of the above on your behalf. But, capital is no good if you don't make that capital work for you. You can lend capital to someone who needs it, and receive interest payments. In this case, interest is simply understood if you think about it as the cost of borrowing money. The name of the game is to either make the capital work for you, or convert that capital to other means of production, which then bring you more capital, ultimately creating a virtuous cycle.
When people invest in stocks, oftentimes they get too caught up and focus only on the price action, and forget the fact that buying a stock represents ownership of the company. In other words, if you own 10% of Tesla's shares, you have ownership of 10% of the company whether the company is valued at $800B or $2T. So what do you do when a company that's supposed to be worth $1T, judging by the amount of money it makes (cash flow) and the growth it's showing, drops to $800B? The most logical course of action is to buy more shares. You want to buy more ownership of the company for a cheap price, because you know that the company is going to buy other people's time (labor) and use that to generate more capital for you.
It seems so easy, but there's a reason why most people fail at investing. Our brains are biologically wired to focus on short term consequences, and we fail to look at what's best for us in the long term. Thus, we make dumb mistakes like selling perfectly good assets just because "the price dropped too much".
"A price drop is an opportunity to buy more of a good prospect at cheaper prices." - Peter Lynch
Unfortunately, most people sell when the price drops, because fear, uncertainty, and doubt take over their mind. There is a reason why billionaire hedge fund manager Bill Ackman bought over $1.1B worth of Netflix stocks when the price dropped. He saw no fundamental changes to the company, yet the price dropped due to certain people's irrational decision to sell. And I'm very positive that there's a high chance that Bill will be the last one laughing in the end.
I believe that there are only three reasons for you to sell a perfectly good asset: 1) when the narrative has changed (fundamental change in the asset), 2) when you find a better asset, and 3) when selling is inevitable to save your entire position (ex. selling to pay taxes). Unless there is a clear reason for you to sell that fits into one of these three criteria, selling is probably not the best idea. If you truly understand what it means to invest, and convince yourself on why you should be buying or selling at certain levels, you can, and will become a successful investor. Think big, be optimistic, and have patience.
If you like this educational post, please make sure to like, and follow for more quality content!
If you have any questions or comments, feel free to comment below! :)

The cycles of the S&P500 | PART 1The cycles of the S&P500 / PART 1
This post introduces a study I'm conducting with the main objective of understanding the cycles and sub-cycles that the S&P500 Index has.
Why am I studying the S&P500? Because it is the most relevant index in the world. There is not any other economy in the world that gets close to the returns of the US stock market as a whole, and also, we have a massive amount of data back from more than 100 years ago. So with all that said, let's start.
The fundamental view I have regarding the market is that the price has moved between periods of fear and optimism through history, on a cycle that never stops. There is either Fear or Optimism, in other way impulses and corrections. On this chart, we can go through periods of optimism and fear caused by multiple factors, different governments, different geopolitical situations, massive crises, changes in interest rate; you name it, all of them are on this chart, the dot com bubble, the subprime crisis, the missile crisis with Cuba, wars, oil crisis, 1929, etc.
The first conclusion I can make at first glance is that despite what was causing it, fear and optimism tend to have characteristics that we may be able to understand. This is a strong base for technical analysis as a discipline. Fear looks the same through several situations, and the same applies to optimism. That's why understanding the price is a powerful element to conclude where we are on the cycle. So what is the price telling us?
In this post, we will not only go through the big cycles, but also we want to understand the smaller ones. Now I will put my main conclusions regarding the information I have found.
THE BIG CYCLE:
--------------------
Impulse 1: 1877 - 1881 = 4 Years / 152% from bottom to top.
Correction 1: 1881 - 1897 = 16 Years / -41% from top to bottom.
--------------------
Impulse 2: 1897 - 1902 = 5 Years / 144% Fromb bottom to top.
Correction 2: 1902 - 1921 = 19 Years / -40% from top to bottom.
--------------------
Impulse 3: 1921 - 1929 = 8 Years / 400% from bottom to top.
Correction 3: 1929 - 1933 = 4 years / -84% from top to bottom.
--------------------
Here we can observe a clear change in behavior regarding impulses. Until 1933 we observe short impulsive periods and long corrective periods. From 1933 until now, this trend reversed, we have long impulsive periods and short corrective periods compared to the past.
--------------------
Impulse 4: 1933 - 1969 = 36 years / 2106% from bottom to top.
Correction 4: 1969 - 1974 = 5 years / -48% from top to bottom.
--------------------
Impulse 5: 1974 - 2000 = 26 years / 2500% from bottom to top.
Correction 5: 2000 - 2009 = 9 years / -58% from top to bottom.
--------------------
Impulse 6: 2009 - present = 13 years / 600% from bottom to top.
In PART 2 of this series of posts , I will go through the sub-cycles we observe from 1933 until now. My main objective is to understand the similarities between these impulsive situations (impulse 4,5 and 6)
Here I give you a snapshot of what will be coming:
Impulse 4 with sub impulses and corrections:
Impulse 5 with sub impulses and corrections:
Impulse 6 with sub impulses and corrections:
Here you can see the Days and % decline of each correction inside the impulses. Thanks for reading! I will be updating this soon.

S&P 500 A study of Market Cycles: Will History Repeat Itself?This video is a study of the history of The stock market when it comes to bull cycles and consolidation/ranging periods, which I think is a very educational thing to investigate in a period of market correction like the one we are currently living in. Please also refer to the Important Risk Notice.

Indexes - What are they and how do they work?Index tracks performance of multiple assets that are grouped together. One of the first people to introduce the concept of indexing were Charles Dow and Edward Jones when they created the Dow Jones index in 1896. This concept allows for an easy tracking of performance of any particular sector within the economy. For example, the Nasdaq 100 index tracks performance of hundred biggest tech companies in the U.S.; similarly, the Russell 3000 index tracks three thousand largest companies in the United States. These indexes contain U.S. securities which account for over 90% of U.S. corporate equity; therefore, analyzing an index provides an investor with information about the overall health of the economy or particular sector.
Diversification
Generally, investing in indexes is associated with lower risk than investing in stocks. This is because indexes are structured in such a way that they diversify risk by tracking performance of multiple assets rather than by tracking performance of one single asset. For example, if an investor's portfolio consists of shares of a single stock company and the value of those shares drops, then it directly affects the portfolio in a negative way. However, if an investor owns an index tracking performance of 10 companies instead of a one stock title, then the investor's risk is diversified among ten companies instead of one single company. Therefore, an index tends to perform well as long as the majority of its components perform well. Similarly, when the majority of companies incorporated within an index perform poorly then the index tends to reflect it.
Illustration 1.01
Illustration above depicts the monthly chart of Hang Seng Index (Ticker: HSI). It is observable that the index performed well in the long-term. Though, massive drops in the index are observable too in 1997, 2000, 2007, 2015 and 2018.
Source: www.tradingview.com
Value of the index and weight distribution
The value of an index is dependent on its underlying holdings; further, it can be based on the price, market-cap or any other metric related to these assets. There are various methods on how to weight an index which plays an important role in how it performs. For example, in an unweighted index all its components have equal significance, regardless of their size. However, in a market-cap weighted index these components hold significance that is proportional to the size of their market-cap. Therefore, a volatile move in a big company would have a bigger impact on the overall performance of an index as opposed to the volatile move in a small company. Most indexes are price-weighted and market-cap weighted.
Indexes as financial assets
Generally, indexes tend to move in trends and produce good results over a long-term period. Index investing is preferable for inexperienced and passive investors because it tends to outperform active management in the long run. Additionally, it takes off psychological pressure that is associated with an actively managed portfolio while providing more free time to an investor. Exposure to an index can be gained by investing in index futures, options, CFDs, ETFs and other derivatives.
Major indexes include:
Dow Jones Industrial Average - thirty large U.S. companies that trade on the NYSE and NASDAQ.
Nasdaq 100 - hundred biggest tech U.S. companies that are publicly traded.
Standard & Poor 500 - five hundred biggest companies in the U.S. that are publicly traded.
Russell 2000 - two thousand smaller companies that comprise the Russel 3000 index.
Russell 3000 - three thousand biggest companies in the U.S. that are publicly traded.
DAX 40 - forty biggest German companies that trade on the Frankfurt Exchange.
Hang Seng Index - sixty biggest companies that trade on the Hong Kong Exchange.
Seasonality and trends
Indexes tend to move in cyclical trends and less often in trading ranges. They are less prone to the effects of calendar and industrial seasonality when compared to stocks and commodities.
Change in components
Since their inception many indexes have changed the composition of their underlying assets. For example, the Dow Jones Industrial Index started as Dow Jones Transportation Average in 1896 and consisted of only twelve companies. These companies operated mainly in railroads, cotton, tobacco, gas and oil sectors. However, eventually new companies were added to the index until it reached the total number of thirty companies in 1928. Since then the composition of the index changed several times; although, the number of companies stayed the same. This concept of rebalancing indexes is common to many other indexes; and it usually occurs on a quarterly basis.
Illustration 1.02
Picture above shows the monthly chart of the Nasdaq 100 Index (Ticker: NDX) between 1995 and 2006. Companies included in this index changed over time. Nowadays, the Nasdaq 100 index includes such companies as Alphabet, Apple, Microsoft, Intel, Tesla, etc.
Source: www.tradingview.com
If you have not read our previous articles on stocks and commodities, please feel welcome to do so. They are attached to this idea. Additionally, feel free to express your own thoughts and ideas in the comment section below.
DISCLAIMER: This analysis is not intended to encourage any buying or selling of any particular securities. Furthermore, it should not serve as a basis for taking any trade action by an individual investor. Your own due diligence is highly advised before entering trade.

What is going on in the market..?All major indexes have reached new lows today and bounced back a little, Which shows sellers are strong..!
on the other hand
they bounce back a little and none of them even touched the middle of yesterday's candle, which shows buyers are not strong enough!
I think any trader in order to be successful should have a predefined plan for trading!
That plan must look like an algorithm code: a combination of 0,1, and, if, or..!
It means:
IF A, B, C... happened I will open the position!
But he should not forget to monitor his position!
So,
IF X, Y, Z, ... happened, I will close my position!
But,
What if A, B, C, .. do not happen for a while?
The answer is I will sit calmly and wait for the next opportunity..! In other words, A, B, C to happen!
One of the biggest trading mistakes is not defining a "No-Trade Zone"!
I think we are at the highest level of uncertainty in the market, in other words, "No Trade Zone".
One question:
Did you define your A, B, C,...X, Y, Z???
Best,
Moshkelgosha
DISCLAIMER
I’m not a certified financial planner/advisor, a certified financial analyst, an economist, a CPA, an accountant, or a lawyer. I’m not a finance professional through formal education. The contents on this site are for informational purposes only and do not constitute financial, accounting, or legal advice. I can’t promise that the information shared on my posts is appropriate for you or anyone else. By using this site, you agree to hold me harmless from any ramifications, financial or otherwise, that occur to you as a result of acting on information found on this site.

Three dangerous beliefs regarding the stock market "It can't keep..."
"It has to..."
"I think it will..."

Some important questions & answers (for beginner investors)Today we prepared for you several questions and answers that might be helpful to new investors. Please feel free to post your own questions and answers in the comment section.
What is technical analysis and why does it work?
Technical analysis is a scientific discipline that analyzes investments by evaluating statistical data (usually price and volume). This method works because of fractal nature which represents the ability of same price patterns to appear across multiple different time frames independently. This applies also to patterns observable in oscillators, indexes and other technical tools.
What trading systems are the best performing ones?
Best performing trading systems are trend based. Purpose of such trading systems is to identify the trend and then „ride it“ – which means investing in its early stage and taking profits in its latter stage.
Which time frame is the most reliable?
Generally, bigger time frames are more reliable as opposed to smaller time frames. Though, patterns and trading signals usually take longer to develop when using a bigger time frame. Most common time frames are: 1-hour, 4-hours, daily and weekly.
What is leverage? Is it a really fast way to make money?
Leverage simply represents borrowing money in order to fund an investment. For example, when a trader uses leverage with ratio 1:10 and underlying asset moves by 1% then leveraged asset moves by 10% in the same direction. Leverage is definitely one of the possible ways to generate money fast. However, it is also a quick way to lose money.
Should I use a leverage when I am new (unexperienced) investor?
Use of leverage by new investors is pretty common as it represents an enticing opportunity to make money fast. However, in our opinion, an unexperienced investor should not use leverage at all. That is because leverage is very difficult to manage and its use by an unexperienced trader usually results in loss of capital.
Is it possible to time exact market tops and bottoms?
Timing exact market tops and bottoms is incredibly difficult even for an experienced trader. There are several technical tools at disposal of a technical analyst which he or she can use to indicate market reversal points. However, picking these exact spots is not necessary in order to turn profitable in trading. As mentioned previously, best performing trading systems are trend based. Such trading systems work by identifying trends and by exploiting them (without requirement to identify exact market top or bottom).
What is diversification? Why should I implement it?
Diversification is one of the possible ways to manage risk in the portfolio. It simply stands for diversifying capital into multiple different investments rather than focusing capital in a single investment. Proper diversification protects investor's capital from price fluctuations within particular market sectors. Additionally, it is crucial in order to build a long-term lasting portfolio.
Should I invest in the stock market when it just reached all time high?
Probably not. Usually, the market tends to pull back when it reaches a new all time high. Therefore, in our opinion it is not best to add to the long position just when a new all time high was reached by an asset. One of the best strategies in a strong bull market is to add to the long position when price drops and then sell the position once an asset reaches new all time high.
Should I invest in an asset just because it fell 90% in value recently?
Not necessarily. Fall of such high magnitude does not necessarily mean that the price trend will reverse. There may be various reasons why an asset fell by so much; and therefore, doing your own due diligence is highly advised before entering any trade.
Is past performance of an asset indicative of its future performance?
No. Past performance of an asset should not serve as a basis for predicting future performance of that same asset.
Should I use options/other derivatives as a new trader?
There is no restriction to use options as a new trader but derivatives in general are more complex instruments than stocks or bonds; additionally, their price is determined by numerous factors that an investor should be aware of. If a trader does not fully understand how some asset class behaves, then he or she should avoid such a particular asset class.
Should I keep holding a losing position?
It depends on the investor's own assumption but in general it is better to close positions that keep losing to prevent further losses and to be able to use capital somewhere else.
I feel I haven’t made many trades in the recent past. What should I do?
Trading is not about making enough trades but about generating profit. Sometimes there are not enough opportunities in the market; making too many trades could lead to entering positions that a trader is not fully comfortable with. Also too many trades reduce profit due to trading fees being stacked up. So if a trader can not find another opportunity to make a trade, the best solution is to take a “break” and to keep looking for the next opportunity rather than force himself or herself into trading.
DISCLAIMER: This analysis is not intended to encourage any buying or selling of any particular securities. Furthermore, it should not serve as basis for taking any trade action by individual investor. Your own due dilligence is highly advised before entering trade. This content serves solely educational purposes.

Options flow predicting moves on Derivatives (Futures)Options have been and are an important instrument on the financial market for a trader trading Intraday Futures. Therefore, while exploring the mechanics of the option market over the last several months, as a result of work, indicators were created that load data from Quandl and then look for patterns that may herald a change of direction on the derivative market - in this case Futures Contracts. There are two main types of Options:
CALL - allow their owner to buy a given product in the future at a predetermined price (Strike Price)
PUT - allow you to sell this product at a predetermined price (Strike Price)
By observing the market volumes of both types of Options, we can observe the sentiment of investors. The key factors are which volume (call or put) prevail in the volume and the dynamics of the volume - what is the trend on volume, whether the difference between them increases or decreases. In addition, the Put / Call Ratio analysis allows you to confirm or negate the signals from the Option volume. The Ratio indicator behaves inversely to the price movement - in the case of a bearish sentiment, we expect the ratio to increase, and in the case of bullish sentiment - the indicator should decrease. If the Ratio follows the price in the same direction, it is an anomaly.
Of course, the mere observation of the Option volumes and the Put / Call ratio is not sufficient, as the Options Market is a much more complicated activity. It is worth including in the calculations such factors as Expiration Date, Bonus Amount, option type (In the Money, Out of Money or At the Money). Not each of the factors is equally important, therefore the key is additionally the appropriate selection of the weighting factors. For this purpose, due to the multitude of data, it is worth using Machine Learning, which I also do by saving the resulting data in a dataset in Quandl and displaying the data in TradingView using Pine Script.
Below are some additional examples from recent sessions on ES showing the predictive nature of the Option sentiment, often preceding major movements in the ES index (during the spot session):
First, from the left, the session from November 15 is shown and an opportunity to play Short. On the right, the session from November 16 and an opportunity to play the Long position this time.
Session from November 10, where we first got the Bull's signal, and at the top we got a warning signal of traffic reversal and the possibility of entering Short:
And one of my favorite moves on November 3:

SPX'S Elliot. What's ABC- WXY- WXYXXZ = Coffee Espresso shots !THE ONLY NOTICABLE DIFFERECNE IS THE CONNECTION WAVE "X" & "XX" IN WHICH THEY CAN
BE ANYTHIGN BUT AN EXPANDING TRIANGLE !!!
Double and Triple ZigZag Rules:
Double (DZ) and Triple (TZ) Zigzags are similar to Zigzags, and are typically two or three Zigzag patterns strung together with a joining Wave called an x Wave, and are corrective in nature. Doubles are not common, and Triples are rare. Zigzags, Double Zigzags and Triple Zigzags are also known as Zigzag family patterns, or 'Sharp' patterns. Double Zigzags are labeled w-x-y, while Triple Zigzags are labeled w-x-y-xx-z. Both these patterns are included in the list of rules and guidelines below. Only a Double Zigzag is illustrated below.
Wave W must be a Zigzag.
Wave C of W cannot be a failure.
Wave X can be any corrective pattern except an ET.
Wave X must be smaller than Wave W by price.
Wave X must retrace at least 20% of W by price.
The gross price movement of Wave X must be less then 3 times the price movement of Wave W.
Wave X must be no more than 5 times Wave W by time.
Wave Y must be a Zigzag
Wave Y must be greater than or equal to Wave X by price.
Back to back and double failures are not allowed.
Wave Y must be greater than 90% of Wave W by price, and Wave Y must be less than 5 times Wave W by price.
Wave Y must be no more than a factor of 5 times either Wave X or W in price or time.
Wave C of Y cannot be a failure.
Wave XX can be any corrective pattern except an ET.
Wave XX must be smaller than Wave Y by price.
Wave XX must retrace at least 20% of Y.
The gross price movement of Wave XX must be less than 3 times the gross movement of Wave W.
Wave Z must be a Zigzag
Wave Z must be greater than or equal to Wave XX by price.
Wave Z must be less than 5 times Wave Y by price, and must also be less than 5 times Wave W by price.
Wave Z must be no more than a 5 times either Waves XX, Y, X or W in both price and time.
Double and Triple ZigZag Guidelines:
The largest Wave in Wave W is usually less than Wave W by price.
Wave X is usually a Zigzag family pattern.
Wave X is usually less than 70% of Wave W by price.
Wave X will usually retrace at least 30% of Wave W.
Wave X is most likely to be a 38.2% retracement of Wave W.
Wave X is next most likely to be a 50% retracement of Wave W.
Wave X is next most likely to be a 61.8% retracement of Wave W.
The largest Wave in Wave X is usually less than 140% of Wave W by price.
The time taken by Wave X is usually between 61.8% and 161.8% of Wave 1.
Wave Y is next most likely to be equal to 61.8% or 161.8% of W by price.
Expect the time taken by Wave Y to be between 61.8% of Wave W and 161.8% of shortest of Wave W and X.
Wave XX is usually a Zigzag family pattern.
Wave XX is usually less than 70% of Wave Y by price.
Wave XX will usually retrace at least 30% of Wave Y.
Wave XX is most likely to be a 38.2% retracement of Wave Y.
Wave XX is next most likely to be a 50% retracement of Wave Y.
Wave XX is next most likely to be a 61.8% retracement of Wave Y.
The largest Wave within Wave XX is usually less than 140% of Wave Y by price.
Wave Z is most likely to be about equal to Wave Y by price.
Wave Z is next most likely to be about equal to 61.8% or 161.8% of Wave Y.
The largest Wave in Wave Z is usually less than Wave Y by price.

H&S Pattern can be either horizontal or sloping up/down neckline
( """ The pattern consists of a head (the second and the highest peak) and 2 shoulders (lower peaks) and a neckline (the line which connects the lowest points of the two troughs and represents a support level). The neckline may be either horizontal or sloping up/down. The signal is more reliable when the slope is down rather than up.
The pattern is confirmed when the prices broke below the neckline after forming the second shoulder. Once it happens, the currency pair should start a downtrend. So, a sell order is put below the neckline. To get the target measure the distance between the highest point of the head and the neckline. This distance is approximately how far the price will move after it breaks the neckline.
source FBS

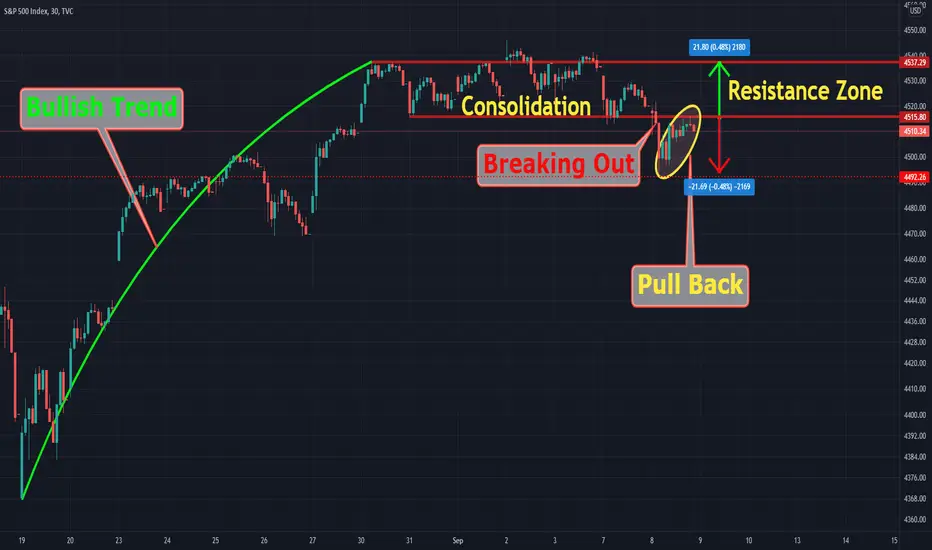
Breaking down a movementMy goal is to help others see the reason behind my analysis and hopefully they learn something new or at least review what they already know
I believe to be successful in the analysis regardless of the timeframe you should breaking it down to pieces and manage it piece by piece:
1- A bull trend is a period of time in financial markets when the price of an asset or security rises continuously.
2- A sideways trend is the horizontal price movement that occurs when the forces of supply and demand are nearly equal. This typically occurs during a period of consolidation before the price continues a prior trend or reverses into a new trend. A sideways price trend is also commonly known as a "horizontal trend."
3- A breakout refers to when the price of an asset moves above a resistance area, or moves below a support area. Breakouts indicate the potential for the price to start trending in the breakout direction. For example, a breakout to the upside from a chart pattern could indicate the price will start trending higher.
4- A pullback is a temporary reversal in the price action of an asset or security. The duration of a pullback is usually only a few consecutive sessions. ... Pullbacks can provide an entry point for traders looking to enter a position when other technical indicators remain bullish.
5- Resistance occurs where an uptrend is expected to pause temporarily, due to a concentration of supply.
Reference Articles:
www.investopedia.com
www.investopedia.com
www.investopedia.com
www.investopedia.com
www.investopedia.com
Now let's review my trading setup published last week:
Global events - the last 18 Months. I recently posted a timeline of Bitcoin events as well as record several videos on the current Elliott Wave moves around Bitcoin, DXY and a few Forex pairs.
Here’s a link to the Bitcoin timeline;
Looking back at the last 18 months or so now, I wanted to cover some of the significant events that have taken place, which would have had some (but not as much as you think) of an effect on the Elliott counts as a whole. For those of you not familiar with Elliott, there is a link in the ‘related ideas’ section covering the basics.
So, let’s go back in time;
Brexit announced back in 2016 – carried through and completed in 2020.
Thus, kicking off the year with a fair size event, the global markets not quite sure what the fall out would be, where the damage would come and of course if there where to be profitable positions to obtain. An awful lot of hesitation & fear seen in the market.
Jump forward to the next big event; although COVID-19 was technically pre 2020, the real effects did not start to emerge until early 2020 when the world went into LOCKDOWNS, crazy mayhem soon followed and has not really disappeared since.
After the world starts to go mad! A few other things happen during this period!
- Oil goes negative for the first time in HISTORY
- Gold hits $2,000
- S&P creates an all-time high
If this was not enough to cause global confusion, we also had an interesting period in the United States.
All though there are plenty of other events that have shaped this last 18 months or so, you can clearly see with so much – the charts will be a little more sporadic, a little harder to read. So, although methods such as Elliott and Wyckoff are still very powerful.
Even Wyckoff Schematics got a good run in the social media platforms! (Probably kicked that off in March) 😉
Interesting times ahead - @TradingView community, take care of yourself and keep in mind! It’s been a crazy 18-months, 2 years!
**(This is not a trade idea, even a bias - it's just highlighting how insane these last 18-months have been)
For education on Wyckoff and Elliott - see my bio below;
Disclaimer
This idea does not constitute as financial advice. It is for educational purposes only, our principle trader has over 20 years’ experience in stocks, ETF’s, and Forex. Hence each trade setup might have different hold times, entry or exit conditions, and will vary from the post/idea shared here. You can use the information from this post to make your own trading plan for the instrument discussed. Trading carries a risk; a high percentage of retail traders lose money. Please keep this in mind when entering any trade. Stay safe.

Why the S&P500 Micro Futures is one of the best markets to trade Hey Traders so today I wanted to show you a great market to consider trading the S&P500 Micro Futures. I think it is one of the easiest markets to learn vs the Forex and others. It offers great leverage and really good risk vs reward. Of course futures are different from stocks, crypto and forex. The are considered high risk because of the volatility and leverage. But definitely I think they are a good asset class to consider adding to every traders portfolio with the right risk management. Plus this market is a great way to start capturing all the great gains that the stock market has had in the last 10 years. As long as the bull market continues I think this market will remain strong.
Enjoy!
Trade Well,
Clifford

The Importance of Understanding the Commodities MarketIn this educational post, I'll be explaining the reason why both investors and traders need to understand the commodities market.
The commodities market is a market in which raw, hard, and soft commodities are traded.
Examples of commodity assets include gold, oil, wheat, grain, copper, and even livestock.
While these aren't commonly traded markets among retail investors, understanding assets within the realm of commodities can provide an edge in trading and investing.
Benefits to Investors
- The primary reason that investors needs to understand the commodity market is because it helps provide an overall picture of the entire financial market.
- For instance, in the case of Nickel, Copper, Zinc, and other industrial metals, the price action differs depending on the market cycle, and certain metals are sensitive to, and heavily affected by specific industries.
- Popular commodities like Gold and Oil’s price action reflects the overall market trend and sentiment.
- As such, a retail investor with a deep understanding in commodities is capable of looking at the stock market from a different angle.
- Secondly, understanding commodities provides a huge advantage in terms of portfolio management.
- How 'well' you have invested, isn't simply determined by your annual return.
- Your sharpe ratio (your return divided by the volatility) tells a more accurate story.
- In order to succeed as a retail investor, you need to focus on increasing your sharpe ratio, or your risk adjusted return.
- And the best way to do so, is to diversify, specifically by looking at the correlation between certain assets.
- There are a plethora of assets in the commodities market that provide a great hedge / means of diversification against the stock market.
- Leveraging this knowledge will help investors design a portfolio that provides them great risk-adjusted-returns.
Benefits to Traders
- The commodities market can be a great opportunity for traders, as long as they spend their time getting used to the market.
- Normally, when the stock market is overbought, or when it demonstrates sideways action, traders often make the mistake of overtrading.
- Traders enter positions at suboptimal levels, because they have no option but to trade at the stock market.
- However, understanding the commodity market gives them an edge. The best analogy to explain this, is like playing online poker.
- When playing poker, the player waits for good hands to appear, so he can make a bet in his favor.
- When he plays online poker, he can have multiple games going on at once, and play the game where he gets the upper hand.
- In the same vein, when a trader knows how to trade commodities, instead of waiting for a good entry in the stock market, he can simply trade assets within the commodities market.
- If you think stocks are overvalued, there’s a chance for you to move onto gold, silver, oil, or even industrial metals.
- You can take a look at multiple assets, and find one that has a good risk/reward ratio right now.
Conclusion
The commodity market is a market that is huge in size, yet often overlooked my many, if not most retail traders and investors. However, understanding which assets are traded, their price action (in relation to other assets), can help both investors and traders acquire an edge.

Importance of diversification across asset classesAny feedback and suggestions would help in further improving the analysis! If you find the analysis useful, please like and share our ideas with the community. Keep supporting :)
In this post, we have attempted to cover the importance of portfolio diversification. To drive our point home, we have taken a 2-year reference and divided it into 3 parts:
Pre-pandemic : January 2019 to 10th Feb 2020
Height of the pandemic : Feb 2020 to 23rd March 2020
Post pandemic : 30th March 2020 till present
The 3 classes of asset that we included in this analysis are:
Cryptocurrency- ETH
Stocks- S&P 500
Commodity- Gold
Pre-pandemic period: ETH was on a bull run as were other major crypto currencies. It shot up more than 125% during that period. The S&P 500 index was up by 38.5% during the same period, while the precious commodity, Gold, rose by 24.15%.
At the height of the pandemic: It was a testing time for the diversification of portfolio. Holding any particular asset class and not diversifying at all, proved to be a disaster for many naive investors. ETH dropped by approximately 65%. The S&P 500 index tanked almost 33%, while Gold, considered to be the safest asset, lost 12%.
Post-pandemic period: It was one of the massive bull-runs in the history of bull runs. Patient investors who entered into the markets at the height of the pandemic saw their wealth growing multiple times. Moreover, with the Central banks around the world printing currencies at a furious pace, the only way to beat inflation was to invest in high alpha generating assets.
ETH shot up almost 1800% during this period, which is a 18x return. The S&P 500 shot up over 94%, while Gold went up by a meagre 21%.
Considering the returns and the risk over these 3 periods, it can be stated with absolute conviction that the need for diversification is supreme.
----------------------------------------------------------------------------------------
Any feedback and suggestions would help in further improving the analysis! If you find the analysis useful, please like and share our ideas with the community. Keep supporting :)

A "Welcome to" Pinescript codingThis simple idea is an intro to @TradingView & @PineCoders
Nothing fancy or complex, if you are already coding - you can skip this.
simple MA build walk through & adding a second MA.
If you want to get into coding, then here's the basic introduction.
FYI - I am not a coder, 21 years trading experience and know a bit about the instruments - but new to actual coding, especially in Pine.
Hope it helps someone!
Disclaimer
This idea does not constitute as financial advice. It is for educational purposes only, our principle trader has over 20 years’ experience in stocks, ETF’s, and Forex. Hence each trade setup might have different hold times, entry or exit conditions, and will vary from the post/idea shared here. You can use the information from this post to make your own trading plan for the instrument discussed. Trading carries a risk; a high percentage of retail traders lose money. Please keep this in mind when entering any trade. Stay safe.

The Basics - Trend LinesTrend lines are used in technical analysis to define an uptrend or downtrend. Traditionally, uptrend lines are made by drawing a straight line through a series of ascending higher troughs (lows). ... With downtrends, trend lines are formed by drawing a straight line through a series of descending lower highs.
In an uptrend, the “imaginary line” acts as support and in a downtrend, the line connecting the points at swing highs become the resistance.
Although we can go into what and why – the logic for trend line, is to keep it simple. It’s another subjective area and people like to spot patterns. It’s human nature.
This shows in it's most basic form the concept of a trend line.
In an uptrend we want to see, higher highs as well as higher lows as shown below;
And in a down trend, the opposite is true - Lower highs & lower lows to create the pattern as per main image of this post.
Many other techniques and indicators use this concept, and perhaps the most famous being Elliott waves.
Here's a post on Elliott basics;
This then all points back to Dow Theory - where markets have 3 cycles and 3 waves (another lesson for another time) in short;
Here's also a post covering the Dow basics;
You can also use Moving averages as part of "working out the trend"
And her is another simple guide to MA's (moving Averages)
We thought it would be interesting to post, more of a beginners post that our usual stuff. Hope this helps some of the newer traders.
Disclaimer
This idea does not constitute as financial advice. It is for educational purposes only, our principle trader has over 20 years’ experience in stocks, ETF’s, and Forex. Hence each trade setup might have different hold times, entry or exit conditions, and will vary from the post/idea shared here. You can use the information from this post to make your own trading plan for the instrument discussed. Trading carries a risk; a high percentage of retail traders lose money. Please keep this in mind when entering any trade. Stay safe.

Ultimate Divergences Course: FREE MaterialIf you like our content then follow us for up to date news and analysis.

The Lazy Man's Guide To ELLIOTT WAVEElliott Wave Post 2; after writing the first post I have received some questions. So I thought it easier to write a follow-up post here showing some tricks.
To be clear, I am not an Elliottition as a whole, I use it as part of a wider strategy on the monthly and weekly timeframes. But also we have access to an automated Elliott wave tool.
The Elliott wave logic still works today and with a couple of little tricks, you will be able to use to help forecast potential target zones. Elliott can be very subjective and the saying goes "if you ask 10 Elliott wave traders where to plot the waves, you will get 9 different answers" So just like everything else, you need to use it wisely and not rely solely on it.
Again to reiterate - this is not a full-out lesson, there's more to learn on the topic. But these little tips will help you along the way, even to get into the overall concept a little quicker.
Step 1 - if you have this in your mind, you will be able to start the process for an overall measure.
Major rule
Wave 2;
If you can identify a wave 2 but it is less than 50% of wave 1 - be careful as it could create a double bottom (in an uptrend) and dip a little lower before moving up.
with 1 & 2 identified you can start working on estimations for 3.
Knowing wave 3 is usually 1.618 or 2.618 - will give you a good idea of where price is heading. Again you could use things like Stochastic or RSI to assist the directional bias when you feel you have identified the 2.
Let's go all out - let's say we have the perfect setup...
We can also say that a lot of the time, wave 4 is around 38.2% of wave 3 and often no greater than 50% (whereas, wave 2 is often more than 50%)
Then lastly, if we know a potential target for 3 (maybe draw 2 target levels to test) we can use that with 2 levels for the 4 move 382 and 50 as a rule of thumb. You can see what works best for the instrument you are trading. How they play out with backtesting and so on.
It would be great to get some additional comments from traders who use Elliott every day, even from new traders only now getting into Elliott waves. Any additional tips or trips from the pro's for the newer traders?
If you are new to Elliott waves - see the related post below for the basic concept.
Disclaimer
This idea does not constitute as financial advice. It is for educational purposes only, our principle trader has over 20 years’ experience in stocks, ETF’s, and Forex. Hence each trade setup might have different hold times, entry or exit conditions, and will vary from the post/idea shared here. You can use the information from this post to make your own trading plan for the instrument discussed. Trading carries a risk; a high percentage of retail traders lose money. Please keep this in mind when entering any trade. Stay safe.

How To Lose Money With CONFUSION (timeframe mixing) The issue for many new traders is understanding the correlation between timeframes. We often get caught up in indicators, news hype, chat room posts, and various other things.
One of the biggest challenges I see when talking to new traders is simply the lack of "experience" in reading multiple timeframes. This causes confusion and even self-doubt. The issue with the internet being so vast is there is a lot of info - but what do you go with & why?
In this post I have tried to "dumb it down" - the simple idea is to pick your timeframes based on your trading style.
Now if work gets in the way and you need to trade end of day or even swing (Longer-term) then really, you shouldn't stress so much about a 15 minute candle. A lot can happen throughout the day. But on the opposite side of the spectrum, if you are sat in front of your screen every minute the market is open. (scalping) then trying to work out what the monthly is doing whilst you hold a trade for an hour is not going to affect your trade (in general).
To give you a great example of this - I trade COT data as it's swing, with Monthly and weekly bias. I will have a mentee say something like "COT is a buy, but the price has dropped". Yes if you're looking at the 4-hour candle. If you think what institutional players can manage in terms of drawdown, especially using hedging techniques. It's far greater than the guy investing £5k of savings into Bitcoin.
If a hedge fund buys Bitcoin at 45k and the price drops to 22.5k - the likelihood is they have a hedged position & will be buying it all back at fair value. Whereas Mr £5k has lost some sleep & half of his capital - bailed, only to see the price shoot back up above his original entry.
You think of someone like Elon Musk - if his entry of a Billion Dollars was at 40k (example) and price drops to 20k, he has a paper loss of 500m for sure, it will hurt. But again if the Tesla share price drops from 800 to 700, he has a paper loss of (say 20 Billion) - a 500m loss on paper is less of a concern. *** You get the picture.
Investors & traders know that things don't just moon! they have dips, impulsive moves and so on.
So take the charts into account - You have an idea of what timeframes to pick based on your own personal availability or your style you have already identified. As a scalper it's easy to use 4 hour or even a 1 hour candle for your bias - a 15minute for a local area of interest & an entry on a 1m - 5m chart. (example only).
If you trade swing trades (depending on the overall time & expectations) a weekly bias, a daily interest and a 4hour trigger could be what you look for.
Here are some examples;
In these examples - all I have done is used 1 tool. This is only to show the idea - If stochastic is up then I want to be Bullish, if down I'll consider Bearish moves. Keep in mind this could be anything from above/below a moving average, a key price level or a magnitude of other things. Even other tools like RSI for example.
Example of step down
The idea is this gives you a directional bias.
Then we look at the area of interest.
And finally - we want to look down on the next timeframe for the trigger (entry)
Traders can easily get confused with one timeframe saying one thing and the next timeframe up or down saying something else. If you can treat it like a tick sheet, you can step down with confidence and work on a strategy favouring your directional bias & that's in confluence with the time period & your expectations.
This really is an oversimplified breakdown. Just to give a general idea.
Have a great week!
Disclaimer
This idea does not constitute as financial advice. It is for educational purposes only, our principle trader has over 20 years’ experience in stocks, ETF’s, and Forex. Hence each trade setup might have different hold times, entry or exit conditions, and will vary from the post/idea shared here. You can use the information from this post to make your own trading plan for the instrument discussed. Trading carries a risk; a high percentage of retail traders lose money. Please keep this in mind when entering any trade. Stay safe.
