📊Bitcoin HIDEN pattern!Every pattern in trading is created by someone. Why not be the author of the pattern? If you see a succesfull price pattern, you can make a backtest and use it in your trading strategy. In this idea i`ll show you some BTC pattern which the crypto follow for 4-5 years.
This pattern is very simple. After the consolidation the price break the range and fell. After dumpo for 50-60% which is liquidated all margin long traders the price continue it`s rise for XXX%. The key thing is the consolidation for 5-12 months.
Consolidation is the price movement is the range. Price can consolidate not only inside the patterns as it shown on the chart (channel, triangle, etc.), but just inside the price range $10-12k, $18-22k etc.
How does consolidation happen? Consolidation in the price range appears because of the uncertainty of traders in which direction the price will go. When there is conditionally 50% of long traders and 50% of short traders in the market, the price can move only in a narrow range due to uncertainty.
What happens when price breaks through a consolidation? For an example of consolidation, let's imagine that price is a spring. The harder the spring is compressed, the more it bounces back. When the price breaks through the consolidation, it contracts like a "spring" and most often falls by 40-50%, as you can see on the chart.
After such a huge drop and the liquidation of all long traders, price bounces up. Since most long traders became fuel for the fall, now the short traders who wanted to make money on the fall become fuel for the growth. Now it`s the same!
Is the BTC reach the bottom and can start the growth? A lot of traders expect the DUMP to 12-14k and as we know everyone can`t earn, only prepared one.
What the price mark will be the bottom for BTC? Or BTC already there? Leave your thoughts on it in the comments!
💻Friends, press the "like"👍 button, write comments and share with your friends - it will be the best THANK YOU.
P.S. Personally, I open an entry if the price shows it according to my strategy.
Always do your analysis before making a trade.
Altcoins

⌛️ Bitcoin vs. Altcoins? Which will have more power?Hello, dear TradingView members.
Here is an idea about Bitcoin and Ethereum and their Dominance.
This idea aims to talk about what will happen after the correction ahead of us in the near future.
There are four charts on this idea:
The first one is the Bitcoin weekly chart.
This chart shows that Bitcoin is on edge and pushing down.
This descending trend is confirmed by the Elliotte Waves and Fibonacci Retracements levels.
The price of Bitcoin has already pulled back from point C to D, and once again got rejected and now is continuing the correction.
Once the price gets to the solid support, it might fall even more due to psychological panic in the market.
The second chart is the Ethereum weekly chart.
This chart also shows that ETHUSDT is pushing down even more and has already crossed vital support levels.
However, four of my Fibonacci indicators show that the solid support offered on this chart is powerful and be a good level for opening long positions.
The third chart is the Bitcoin Dominance chart.
This chart shows that the liquidity in the cryptocurrency market is pouring into the Bitcoin market. This liquidity is coming from Ethereum and other altcoins.
This suggests that Bitcoin for future long positions is a better choice since it is becoming more stable than other crypto assets.
The fourth chart is the Ethereum Dominance chart.
This chart shows the liquidity exiting from the Ethereum (Mother of altcoins) market.
When this happens, it clearly means that ETH and other altcoins are becoming weak and less stable than BTC due to the low volume of liquidity and power.
To sum it up, our result is:
By breaking the Bitcoin Dominance upwards and the Ethereum Dominance breaking down, it can be concluded that bitcoin is in a better position than the altcoins.
So Bitcoin will have more growth and less decline than the market.
Moreover, we can profit more in long trades from Bitcoins and short transactions from altcoins.
In the near future after the corrections, we also use RSI to measure the accuracy of this forecast.
This correction is taking place because the market needs to fill the gap. If you need to know about Bitcoin's gaps, this chart might be helpful:
If you need to learn how RSI works, this chart might be helpful:
If you need to learn how Fibonacci works, this chart might be helpful:
I hope this idea can be helpful.
Let me know if you guys have any questions;
I will be more than happy to help.
Good luck, and thank you.

📊Bitcoin consolidation pattern! Read the description!Hi friends, you've probably noticed that Bitcoin and cryptocurrencies start to rise or fall after consolidation. In this idea I will explain why consolidations happen, how to use this in cryptocurrency market analysis and where the next ATH for Bitcoin will be.
📊What is a consolidation? Consolidation is the small price range. Unlike a bullish or bearish trend, a consolidation is the absence of a trend. As we can see from the chart after consolidations price fall or rise for amazing %. In trading it calls "become volatile".
🔸Why consolidations happen? Actually, consolidations happen because of traders sentiment. If the price don`t move in any side this is bad for most of them. As we know, the biggest part of traders earn on the huge price movements. So when the price start consolidate there are no bull or bear power and price move in the range.
🔸What happend when the price leave the consolidation range? Consolidation is like a spring. The harder you squeeze it, the more it bounces back. It's the same with the price. For example, Bitcoin starts to rise or fall a lot when it comes out of consolidation, the spring rebound, and this has happened in all the examples in Bitcoin's history.
🔸What will happen to BTC next? For more 516 days BTC price is in $29-64k consolidation range. Now we can see the largest consolidation since 2015-2016 before the price reached ATH in 2017.
📈If we follow the rule that the longer the consolidation, the bigger the fall/rise, it's actually hard to predict what will happen next. In any case, Bitcoin will not be able to grow by 5000% in the next bull cycle because of its huge capitalization, but 600-900% growth from global lows ($20-26k) is quite possible.
🚩Traders, what do you think about this pattern? What will be the next ATH for Bitcoin in the next bull cycle based on this rules? Write in the comments, let's discuss it together.
💻Friends, press the "like"👍 button, write comments and share with your friends - it will be the best THANK YOU.
P.S. Personally, I open an entry if the price shows it according to my strategy.
Always do your analysis before making a trade.

📊Why do the trading patterns work?Hi friends! Probably all traders began their career by learning the trading patterns.
A trading pattern is a price movement pattern in a certain range. Generally there are 2 types of patterns: candlesticks (shooting star, hammer, bullish or bearish engulfing) and figures (triangles, channels, flags, head and shoulders, etc.). The number of them is constantly increasing, through the change of market, but there are up to 50 main patterns.
📊So why do the trading patterns work?
The answer is very simple - because many traders use them in trading. Imagine a traffic light with a red light🔴 According to the rules all drivers who have the same signal stand waiting for a green light✅ Here, it lights up and allows all cars to move in the right direction. It's a clear rule, not only in your country, but in all the countries in the world. The situation is the same with trading patterns.
Let's imagine that a chart is a road, and a pattern is a light. The price rises or falls and a pattern is formed. You have determined that it is a bullish pattern, such as a bullish wedge. Of course, you are waiting for the wedge to move to the upper boundary and break it up, that will be a signal to open a trade (green signal to move✅). At the same time, all the drivers (read as "traders") begin buying with you and pushing the price higher and higher.
Why do traders do this? As I said in the beginning, patterns, like the rules of the road, are learned by all traders, regardless of nationality, this is the general rule, that is why these patterns work.
📊In what cases do they not work?
As you know, most people in the market can't be right. Conventionally, if everyone opened a long and bought Bitcoins at $50,000 and the price went up to $100,000, then someone should have bought those Bitcoins from you for 100% more. If everyone held a long, there would be no one to sell and no one would make a profit in the end. That's why there are always 2 sides in trading: buyers and sellers.
With the increasing popularity of patterns, most traders and especially beginners who first study patterns began to open trades according to these rules and .... took a loss. Patterns work especially badly on the cryptocurrency market, which shows how young this market is. But why? All because most cannot be right when trading patterns, otherwise no one would make money.
📊What should I do if I trade only paterns?
I would recommend adding more rules to your trading strategy. These can be different trading tools, filters which will help you to remove "fake" signals and increase win rate. For example, trade not the triangle pattern, but its false breakout using a volume indicator:
1️⃣A false breakout in most cases shows that the price will not go in the direction of the breakout, as there are too many willing to open a trade in the direction of the price movement.
2️⃣The volume indicator will show the actual number of buy and sell orders. If the volume at a false breakdown of the lower boundary of the triangle has increased - this tells us that the price is more likely not to move down, as there is serious support there.
This is the simplest example. You can also use indicators, additional trend lines, candlestick or fundamental analysis.
💻Friends, press the "like"👍 button, write comments and share with your friends - it will be the best THANK YOU.

Relationship Between BTC.D and BTC price and Altcoin priceshello friends today i want to tell you how can you peredict altcoins behavaior according to the
bitcoin price and bitcoin dominance.
so come with me to say you how it works:
liek you can see in below chart :
if BTC price increase and BTC .D( Bitcoin Dominance) increase too ====> Altcoins price decreases.
if BTC price decrease and BTC .D increase ====> Altcoins price Dump and decrase heavy.this is dump phase.
if BTC price go sidewalk(without up or down) and BTC .D increase ====>Altcoins price dont change and this is accumulation phase.
if BTC price increase and BTC .D decrease ====> Altcoins price increase quickly and this is altseason.
if BTC price decrease and BTC .D decrase too ====> Altcoins prices go sideways.
if BTC price go sidewalk and BTC .D decrease ====> Altcoins prices increase.
hope this article be useful for you.
please support me for more useful subjects.
thanks friends.

📊How to use Volume indicator to identify the BOTTOM?...and finally buy the right BTC and ALTs dip!😊
Hi friends! Lots of traders buy crypto at the ATH or close to it in hope to make 10x,100x etc. Is it possible and how to do it more succesfull? In this idea i`ll share with you some methods that can realy help you to:
🔶 identify the bottom of the market
🔶 use the volume indicator in right way
🔶 get crypto at a discount
1. Identify the bottom of the market. Already in several ideas I explain you how you can identify the bottom of the market, and traders shared their ideas in the comments also. We will not stop for a long time around all the methods, you can read about them in this idea and in the comments below it.
💹In this idea I will talk about the fundamental method of how to identify the bottom - liquidation . Liquidation is the process when the exchange takes traders' money to cover losses of a long or short. This can happen if you use leverage in trading and do not use risk and money management. 'Cascades of Liquidations' happen when the price falls without any stops by 30-50%. This is a result of not enough buyers in the market to hold the price and as the price drops, more and more leveraged positions get liquidated - it's like a snowball effect🏂 I've seen this in 2018, seen traders who entered the crypto market in the spring of 2020 and most recently in 2021.
2. Use the volume indicator in right way. Why do I use a volume indicator? It's very simple. This is an indicator that shows where a big players open or close their trades. 🚩If a huge liquidations have happened, someone has sold a lot and someone has bought a lot. Why? Just as DOM and Footprint help to identify whale buying or selling orders, so the volumes show the amount of money traded and help to identify liquidations. Also, it can be used at different timeframes to see whales' willingness to buy or sell at key levels, trend lines and other trading instruments. Volume is a real representation of the number of trades.
3. Get crypto at a discount. If you wanted to buy Bitcoin at 60k, why when it drop by 70% you don't want to buy it? Or altcoin, which is down by 95%? A simple example, when you go to the store you want to buy a car with a discount . If there are two identical Lambos🚙 which cost $250,000 and $100,000, why do you want to buy the one that costs more? Ask yourself this question. This is not financial advice, just a comparison of facts and explanation of traders psychology.
✅As we can see on the chart, the last time after such a massive liquidation in 2020-2021, Bitcoin and Ethereum rose by 1100% and 3400%. For example, Binance Coin (BNB) rose by 6460%, Cardano rose by 11400%. Also, after the last liquidations in 2021, there was a good ALTSEASON, when Bitcoin grew by 100%, and all Altcoins by more than 300%.
🏁My personal advice if it`s happen again:
1. Remember about your risks and money management.
2. Use your strategy and don`t panic. You need to just wait for good entry point.
3. Use VOLUME indicator like an additional tool. This indicator can help you to identify the bottom, but not to do all the work for you.
💻Please write in the comments if you still have the questions about the liquidations or Volume indicator! I`ll try to explain you additional tips 🎇
Press the "like"👍 button, write comments and share with your friends - it will be the best THANK YOU.
P.S. Personally, I open an entry if the price shows it according to my strategy.
Always do your analysis before making a trade.

AXS, how to trade using KEY LEVELS? FREE education!Key Level. How can a common tool help you to earn more? Let's take Axie Infinity (AXS) as an example!
A key level is a local minimum or maximum. It can be clearly marked after a BIG price movement up or down (points of extremum). Key levels are often the price of 1, 10, 50, 100 dollars, because many traders pay attention to this numbers.
On the chart we have marked two key levels:
1. lower (for longs) - $44.68
2. upper (for shorts) - $72
When to open a trade:
1. on a test of the key level as support or resistance;
2. on false breakdown of the level.
IMPORTANT: IN BOTH CASES, VOLUMES MUST INCREASE! It`s an indicator that a big player opens a trade too!
Using the KEY LEVELS you could earn: +62%, +62%, +38%. Risk to reward for these trades from 1:7 to 1:14(!). It's a good statistic, right?
If you still have questions how to use the key level and what tools can be used to increase your profitability - write in the comments or to the DM.
Friends, push the like button, write a comment, and share with your mates - that would be the best THANK YOU.
P.S. I personally will open entry if the price will show it according to my strategy.
Always make your analysis before a trade.

Is SHIB in the ACCUMULATION phase? Identifying the WHALES!Shiba Inu (SHIB) is one of the most popular project of 2021. After the accumulation phase, it rose by about 1000%!
Now the token has dropped by 70% of its ATH and has been consolidating for about 2 months. Could this mean the beginning of a new growth phase?
Accumulation phase is the purchase of cryptocurrency by BIG players to sell higher to the retail investor.
There's not a lot of HYPE around this token right now. Retail traders who have lost 20-50% of their money are starting to sell out in a panic. At this time, the BIG players buy the available tokens from the market to sell higher to new traders who will come on the next HYPE. The same situation as it was in 2021!
It is important to say that if Bitcoin starts its drop, then altcoins will drop too.
Is this really the accumulation phase and we close to RENEW the ATH? We will only know after some time, but we already see the signs of accumulation phase on the chart.
Friends, press the "like" button, write comments and share with your friends - it will be the best THANK YOU.
P.S. Personally, I open an entry if the price shows it according to my strategy.
Always do your analysis before making a trade.

Cryptocurency - Coin & Token Types: The Ultimate GuideIt’s important not to confuse the terms “cryptocurrencies” , "Coins " and “tokens,” Different type of them ,as there are fundamental differences that distinguish them.
Summary:
To put simply ,The two most common blockchain-based digital assets are cryptocurrencies and tokens. The biggest differentiation between the two is that cryptocurrencies have their own blockchains, whereas crypto tokens are built on an existing blockchain.
What Is a Digital Asset?
Broadly speaking, a digital asset is a non-tangible asset that is created, traded, and stored in a digital format. In the context of blockchain, digital assets include cryptocurrency and crypto tokens.
What is a cryptocurrency coin?
Cryptocurrency coin, like Bitcoin , is essentially a digital form of money that is backed up by a native blockchain The functions of a coin are strictly monetary — you can use it as a mean of payment, store of value, or as a speculative asset to trade, and essentially that’s it. The features of a coin are also similar to fiat money — it is fungible, divisible, and the supply is limited.
By definition, a cryptocurrency coin serves only as a digital form of money. The most distinctive feature of a coin is that it is native to the blockchain it’s made on and operates independently from any other platform.
Okay, then what is “altcoin”? This is essentially any cryptocurrency coin that has its own blockchain but is not Bitcoin . Some altcoins are just forks to Bitcoin , meaning that they base on Bitcoin’s open-source protocol but still have their own blockchains, like Litecoin. Others, like Monero or Ethereum , are completely independent blockchains.
What is a token?
The token is a non-native blockchain asset and its value goes beyond only monetary functions. Tokens also require another platform to exist and operate.
For example, ETH is a cryptocurrency that is native to the Ethereum blockchain, which makes it a coin. However, one of the primary features of the Ethereum network is the ability to create new tokens within the network. The cryptocurrencies that are created on this network will be called tokens. For example, USDT — the most popular stablecoin pegged to the value of $USD is a token, which operates on the Ethereum blockchain.
A cryptographic token is a digital unit of value that lives on the blockchain. There are four main types:
1-Payment tokens
2-Utility tokens
3-Security tokens
4-Non-fungible tokens
Fungibility :
All crypto tokens break down into two broad categories — non-fungible and fungible, with the latter being the most common type. Fungibility is a feature of a token which essentially means that one token is indistinguishable from another.
In simple words, a dollar is always a dollar, and Bitcoin is always Bitcoin . You can exchange the $10 bills with your friend and each of you will still have the same value in the wallet.
but Non-fungible tokens, or NFTs, are a type of cryptographic token — a digital representation of value that lives on the blockchain.
NFTs can represent the value of physical assets. A painting, for instance. But they can also represent the value of digital assets, such as a short story that is only available online.
NFTs have three characteristics that set them apart from other types of token: 1. THEY’RE UNIQUE -2. THEY’RE VERIFIABLE- 3. THEY’RE TRADEABLE
-Utility Tokens:
Utility tokens are a popular type of fungible tokens that you can think of as the chips at the casino. In the same way that you need to buy chips to play blackjack or poker, you need utility tokens to power the operations on the protocol.
The most famous utility token example is Ether which powers all the transactions and smart contracts on the Ethereum network. As we just said before, ETH can be used as a means of payment, however, its primary purpose is to be utilized in the blockchain.
Social Tokens (fan tokens):Social tokens can be a very interesting type of crypto utility asset that recently gained a lot of popularity among the crypto space and also presented the concept of tokenization to the broader public. In simple words, social tokens are backed by the reputation of an individual, brand, sports club, or just any community
-Security Tokens vs Equity Tokens
In simple, security tokens are common stock on the blockchain. These tokens are similar to the company shares held by the investors and companies usually issue voting rights through a blockchain platform. The tokens are liquidated to create an Equity Tokens. In other words, these tokens contribute an investment contract, where the Investors typically purchase in anticipation of future profits in the form of dividends, equal sharing of revenue generated and the normal appreciation process.
Security tokens bridge the gap between the traditional financial sector and the blockchain framework; it’s one of the reasons banks have initiated the integrated Blockchain frameworks in their system. Issuing security tokens allows investors to raise funds through a thoroughly regulated digital share of its equity, asset or part of the revenue.
The key difference between Security Token and Equity Token is that in the security token, an asset like real estate, gold etc. are used as collateral. However, in the case of Equity tokens, the shares of the company are diluted into tokens.
We can place coins and tokens in different categories as you can see in the chart above, and some of them are common to other categories.
As digital currencies are emerging, various other categories may be added in the future.
-Governance token
Governance token is the type of crypto asset that grants its holders decision-making rights over the project’s protocol, its product, and its features .it represent voting power on a blockchain project. They represent the main utility token of DeFi protocols since they distribute powers and rights to users via tokens. Governance discussions on Yearn Finance. With these tokens, one can create and vote on governance proposals.
-Also Metaverse tokens are a unit of virtual currency used to make digital transactions within the metaverse. Since metaverses are built on the blockchain, transactions on underlying networks are near-instant. Blockchains are designed to ensure trust and security, making the metaverse the perfect environment for an economy free of corruption and financial fraud.
-DeFi tokens represent a diverse set of cryptocurrencies native to automated, decentralized platforms that operate using smart contracts. These provide users' access to a suite of financial applications and services built on the different blockchains.
If you liked this and would like more you can visit us online Hodl & Shill we also have a private Discord Server

Steps to invest successfully #2Hello everyone,
During this video we are going to analyse the following subjects:
- Look at the bigger picture.
- Draw trend lines using the most significant lows/highs.
- Look for support and resistance.
- Look for candles.
- Understand where the stock/coin sits now.
- Reasonably predict where the stock/coin will be in the future.
- Make sure you are using EMA lines.
- When and why placing your stop loss is important.
- Pivot point.
Remember, you will never be right every time. However, the key factor is to limit your risk by buying close to support.
Seb.

Blocknet is -99% down from ATH so Be aware from Shit Coins#BLOCK/USDT
$Blocknet current price is around $0.58
Recently made low of $0.47.
So basically it's almost 99.22% down from All time high of $60.027.
Practically I don't prefer in suggesting these type of Scam/shit coins.
Never choose to go with these kind of Coin, can harm and eat our hard earned money.
Lots of traders and Influencers around the globe just for the sake of some bucks, keep suggesting these kind of Coin with may hit 50x , 100x , 1000x in near future. And suggest to hold for 2-3 years for Huge profit.
In the case of $Blocknet:-
Who invested in December $2017, price was around $60 i.e. ATH & And after 3 year $Blocknet price is at $0.58.
Almost -99% down.
Where is 100x …?
So Guys never invest blindly in any coins for getting Superrich overnight.
At $60 team & insider Sold $1M worth of $Block Tokens.
Now Value of $1M = ~$8000
Lesson for today:- Choose your Influencer wisely. And do your own research before investing. And never enter with full fund in a entry.

Can Technical Analysis Predict The Future?People who tell you, a trader, not to learn Technical Analysis do so trying to keep you ignorant about the true conditions of the markets, not because the tool flawed.
Many of the people fighting it have no idea how it actually works or just can't get their heads around it.
The more I use it, the more I study, the more I practice, the easier it becomes.
It is not about predicting the future.
It is about gaining access to information that can help you obtain, when trading, better results.
If you would like to read into the future try Astrology or Numerology but Technical Analysis is for those who want read the markets as they are.
Try it!
It can be profitable.
It can be fun.
Namaste.

Strong Shakeout/StopLoss-Hunt Reveals The Bottom - RSKThis is the pattern that reveals the bottom for the Altcoins (Altcoins vs Bitcoin).
We are looking at it on the RSK Infrastructure Framework (RIFBTC) chart but it is present/showing up everywhere.
This pattern is what we call a "shakeout" or a stop-loss hunt move.
The market breaks down strong below support just to move quickly back above it.
This started happening 24-Jan. and 7 days later all loses have been recovered and instead of consolidation/sideways we will see a new uptrend form.
Another detail about this pattern is the bullish divergence that always shows up long-term.
If you zoomout, you can see the higher low on the MACD and the lower low on RIFBTC.
Keep this pattern in mind when looking for new trading opportunities.
I really hope it helps.
Namaste.

ALGO and Dow Theory Trading Strategy (CRYPTO VERSION)
The accumulation phase is the starting point of a new trend where the smart money is buying into a stock.
Then we start pushing up which attracts the eye of the general public aka the retail traders.
At this stage, everyone starts to pile in before we reach a climax point.
Uninformed investors continue to buy while at the same time smart money sells their stocks which forms the distribution phase.
Ok.look at the Algorand chart. Are we in the second part of the story?

As we said, Altcoins are recovering and then growingTo the past analysis i told you BTC .D are making head and shoulders and go down and this happen is good for Altcoins , Now Altcoins are recovering and then grow up and we see good pump in the Altcoins .
To the new chart of TOTAL2 you can see this ascending pattern too (Conversely head and shoulders means pump ) .
Really in the past of BTC .D analysis i told about head and shoulders pattern in TOTAL2 and going up ,So you can see !!
Have a good time :)

BTCUSDTHey everyone,
I'm not trying to predict next movement. I can say neither it goes up nor it fall down.
So, please consider this as a tutorial :
1st question : what is an uptrend exactly ?
Uptrends occur when we see higher high and higher low.
2nd question : when can we say an uptrend is getting stronger ?
When we see upward movements which are larger than their previous movements. For example, in a 12345, 23 should be equal or larger than 1 and 45 should be equal or larger than 23.
3rd question : when can we say an uptrend is getting weaker ?
Of course when it's upward movements getting smaller and weaker continuously.
So, as we can see in the chart, as the time passes, we see weaker and weaker upward movements which is a sign of forming falling trends in the future.
BC = 0.78A, DE = 0.618BC and guess the question mark! XY = ?????DE
If XY can not reach DE's height, we will presumably see a price correction in the future.
Furthermore, on daily chart, we can see divergence in RSI which is a sign of future bearish trends.
Also, you can see easily a downtrend in the volume indicators.
An increase in price along with a decrease in volume is a bad sign for the bull market.

#ALTCOINS - Market Update, Can alt coins keep pushing?Previous Total2 Post See Here -
Hey Guys,
420 Investments back again.
So I'm sure everyone is thinking can alt coins continue pushing or is this a relief ralley?
well that's take a look at total2 to see what's really happening.
Daily Time Frame Analysis -
Daily Rsi Divergence Can Be found found
Liquidity Tap into High time Frame Support
Most Recently we have claimed the golden pocket ratio back after the sell, this is bullish behaviour for the altcoin market.
We Retested the 0.618% fib yesterday, giving us confidence and confluence that this is indeed not a relief rally and alt coins have plenty of room to keep growing!
The weekly chart also shows us that there was a weekly swing failure reversal pattern, which simply means alt coins have failed to continue to swing down.
Showing this high time frame reversal alt coins across the board should have some fantastic gains, as we have recently been seeing.
We have some resistances to break through along the way as well which you will find on the chart
I believe the alt coin market cap has much higher targets! and plenty of room left for growth!
Let me know your thoughts in the comments below, thanks for the support!
#420Investments
#420Family

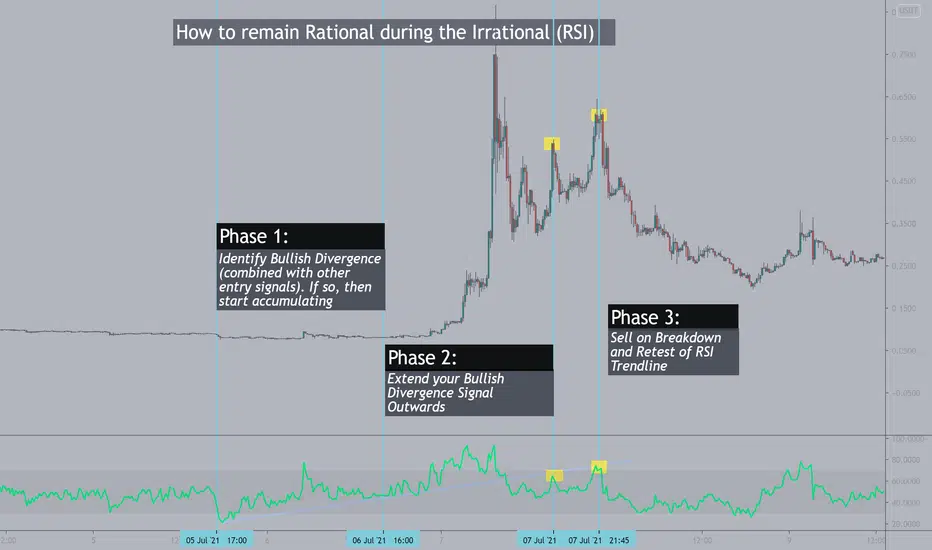
How to Trade the RSI with Irrational Price ActionCheck out the related ideas link for more information.
I hope this adds another tool to your trading arsenal
altcoin marketthe game of altcoin market needs to breakout the 700-750B , so if could , just watch to make new resistance in 1000B, but if can not to break so wait to 300B

BITCOIN. "The cycle of dominance".A table to be able to see how much altcoin can go up or down with respect to the dominance and price of BTC and to know when there is a high season and Dump phase.
BTC dominance graph CRYPTOCAP:BTC.D

Recent editor picks in one place! This post is a little different, I have recently gone back into Trading Education and mentoring and wanted to ask what kind of post or info would the community like?
Here's a list of the recent editor picks; some educational content (each link you can click on to go through to the actual post)
1) Gann Fan Tutorial
2) Buying the Dips made simple
3) Simplified Elliott
4) Elliott level 2 - (not an editors pick) but goes after the Simplified Elliott)
5) Quick intro to Moving Averages
6) Simpson's walkthrough Psychology
7) This one is not an editors pick but goes into more depth around the Simpson's post
8) Trading Can be lonely
9) Not an editor pick but some books for when your lonely
10) Bart pattern - no education but had a pick for this one
11) This land is mine
12) Crypto news and updates (last week)
13) How to do fundamental analysis on altcoins
Some other posts worth mentioning
🍒 COT guide -
🍒 Indicators Vs Price Action -
🍒 Using the comparison tool as indicators -
🍒 Interesting news events on BTC highs/lows -
🍒 Did you know S&P now has Crypto index's?
And have you seen a Wyckoff schematic laying underneath a daily BTC chart? This is awesome!
Disclaimer
This idea does not constitute as financial advice. It is for educational purposes only, our principle trader has over 20 years’ experience in stocks, ETF’s, and Forex. Hence each trade setup might have different hold times, entry or exit conditions, and will vary from the post/idea shared here. You can use the information from this post to make your own trading plan for the instrument discussed. Trading carries a risk; a high percentage of retail traders lose money. Please keep this in mind when entering any trade. Stay safe.

How to assess an altcoinWhen doing fundamental analysis into a stock or in this case a coin – you need to appreciate, it is still a company after all. So, your fundamental analysis should include, taking a deep dive into the available information. You might want to review the project use case, the team, and the money the project has raised so far.
As you can’t really do technical analysis with limited data available on the charts.
Your goal is to reach a conclusion on whether the asset is overvalued or undervalued. At that stage, you can use your insights to inform your trading positions. In other words, have we had a major hype & can a dump be expected?
Trading assets as volatile as cryptocurrencies requires some skill. You will need to define a strategy – otherwise, you are Gambling & not trading or investing.
As for Technical analysis, some expertise can be inherited from the legacy financial markets. Many new crypto traders use the same technical indicators seen in Forex, stocks, and commodities trading.
You often see tools such as the RSI, MACD, and Bollinger Bands which seek to predict market behavior, the issue with this is the lack of data mentioned above. Yet, these technical analysis tools are also extremely popular in the cryptocurrency space.
Slightly harder to read a moving average when the price is in a 90-degree move up.
With cryptocurrency fundamental analysis, though the approach is similar to that used in legacy markets, you can’t really use tried-and-tested tools to assess crypto assets. To conduct a proper analysis, what we need is to understand where they (the company/Coin) derive value from.
====================================================================================================================================
For you newer traders…
“What is fundamental analysis (FA)?”
Fundamental analysis (FA) is an approach used by investors and traders to establish the "intrinsic value" of an asset or business or in this case, crypto. By looking at a number of internal and external factors, their main goal is to determine whether said asset or business is overvalued or undervalued. They can then leverage that information to strategically enter or exit positions.
The goal of this article is not to dive into the methods of FA as a whole, rather just to highlight where you should begin.
====================================================================================================================================
However, there are problems with crypto fundamental analysis (in the traditional sense)
Cryptocurrency networks can't really be assessed through the same lens as traditional businesses. If anything, the more decentralized offerings like Bitcoin (BTC) are closer to commodities. But even with the more centralized cryptocurrencies (such as those issued by organizations), traditional FA indicators can't tell us much.
So now we are stuck between a rock and a hard place…
A quick step would be to identify strong metrics, these should not really take into account things like Twitter or Facebook followers. It’s so easy these days to buy several thousand followers for social media sites.
One method could be; the number of active addresses on a blockchain and see that it has been sharply increasing? For example…
Are we seeing Company actors transferring money back and forth to themselves with new addresses each time? This is the level of info you can go down to – we are on the Blockchain after all.
A little more TECHNICAL
If you want to get a bit more technical – you can look at “On-Chain” metrics in depth. On-chain metrics are those that can be observed by looking at data provided by the blockchain itself.
By running a node for the desired Crypto and examining the data, this can be time-consuming and expensive. Particularly if you are only considering the investment, and don't want to waste time or resources on this process.
A simple way to do this (in some instances) is to use API-based solutions, plug into exchanges, and see third-party tools such as Binance-research's project reports.
Look for info such as;
1) Active Addresses
2) Transaction value
3) Fees – this will give an idea of the demand…
Other areas as mentioned above
You are looking to ‘invest’ in a tech company, which is the longs and shorts of it. So go and read through the whitepaper. Assess use cases, do they make sense to you?
Review the team, do they have experience or have they already raised finance enough to keep the project going – you can now use the chain metrics – to see money flow, you could go and look at the companies register, in the UK all companies are set up under “companies house” this will show shareholders, early account info, company directors.
Other factors
How about competition in the space? What projects are offering similar solutions, are the other companies further along? Does the company you are looking at, have some kind of USP over their competitors?
Supply Mechanisms – Liquidity and volume – Market Cap.
These are all things to take into consideration .
And Finally - Initial distribution and Tokenomics as a whole
A lot of projects have created tokens as a solution looking for a problem. Doge on the other hand created a meme for the market, which is turning into a solution.
Understanding the use case, cannot be stressed enough. As such, it's important to determine whether the token has real utility. And, will it have decent adoption?
Consider how the funds were initially distributed. Was it via an ICO or IEO, or could users earn it by mining?
The whitepaper should outline how much is kept for the founders and team, and how much will be available to investors. If it was mined, you could look to evidence of the asset's creator pre-mining (mining on the network before it's announced).
We have a live stream Monday at 3:30 GMT with @Paul_Varcoe
📺 www.tradingview.com 📺
As I said, this is only to give you a starting point - especially for you newer traders. There are several other factors & methods but start here.

The Anatomy of a Parabolic TrendIn this educational idea I will explain the characteristics of a Curved Parabolic Trend using the chart of BNB:USDT (Binance Coin: US Dollar Token).
-----------------------------------------------------------------------
What is a parabolic curve in a uptrend?
The parabolic curve chart pattern is one of the strongest uptrend patterns a financial asset can have. This type of pattern moves upwards at the fastest and furthest rate of any chart pattern. Each retracement or consolidation is quickly bought up by eager investors as more and more money flows into the market due to excitement.
The parabolic curve is named after the parabola, because the ascending curving trend line used to identify the potential support area looks like a parabola:
en.wikipedia.org
In a Bullish Market Parabolic Trends can often form the smaller timeframe trends making up larger timeframe swings. This pattern creates short term price range bases which are Reaccumulation Phases as described below. These accumulation ranges can form multiple times as it the price keeps going higher.
The price action pattern that creates the parabolic curve looks like a staircase. This pattern can last for weeks or months. The maximum point of financial risk comes in at the end of the formation after the final movement is negated and the price fails to hold the obvious Curved Structure. This usually ends in a price plunge that falls even faster than the price rose initially.
These patterns generally occur on financial assets that are market leaders or up and coming and emerging technologies or products in its sector. One important thing to note when identifying a Parabolic Trend is that the price may go much further then people anticipate leading to sellers rebuying their asset they sold initially due to "FOMO" Fear Of Missing Out, leading to the price to "Stair Step" higher and higher as more and more sellers are squeezed out of the Market, until eventually they regain control and the trend is lost.
The key in trading a parabolic trend is to treat it like a investment, identifying the trend and buying early, capturing as much of the move to the upside as possible until the trend is finally over.
-----------------------------------------------------------------------
If you found the idea insightful you can show you support by liking & commenting, Thank you!
See idea linked below: "Market Cycles & Phases" to understand the topic of trend further.
