Why i TRADE ✅💸 Why i Trade ?
Trading is a serious endeavour where you meet with the financial elites of the world, i will give you couple reasons why i trade and why do i recommend it for you as well.
✅ Be your own BOSS
You don't have a BOSS, you are your own boss. You have to be very disciplined because no one is looking at you to be productive
✅ Freedom of Time
You have the Freedom of Time to work when you want, from where you want. As the advantage above you have to stay very disciplined because it takes time to acquire the skill
✅ Travel
You can travel whenever you want as you are your own boss, this happens only if you are a profitable trader. I dont recommend you to trade during travelling as your focus level hardly decrease
What any advantage you see ?
Bitcoinforecast

Two Biggest Trading Mistakes 📉📉📉✅ Two Biggest Mistakes in Trading .
✅ No STOP LOSS Run the risk of incurring a much bigger loss than expected may lead to wishfull thinking and end up holding and hoping may cause panic selling when trade goes against your direction, no stop loss trading in the long term will kill your account in the short term you can survive.
✅Overtrading - Higher change of losing focus as there are too many traders placed wil be emotionally overwhelmed to perform optimally, placing oversized positions than one can handle financially
What do you think ?

How to Approach the Market by LevelsIn this educational post, I'll be demonstrating how you can approach the market with simple technical analysis techniques, and logic based on simple probabilities.
This is not financial advice. This is for educational purposes only.
Identifying Support and Resistance
- The first thing you want to do, when you begin with a clean chart with nothing on it, is identify support and resistance levels.
- There are a plethora of ways to do this - you can do it using technical indicators, heat maps, order books, etc
- The more I chart, the more I find it convenient and accurate to identify support and resistance zones based on past price action.
- Thus, for this example, in lieu of using complicated indicators or moving averages, I've decided to simply identify key levels of support and resistance.
- Let's begin with the lowest point of support at $40.7k
- This is a level that has been tested countless times, both as support and resistance, during this entire trading range of $30-60k since last year.
- As we are currently trading above this level, this key region plays the role of support.
- If bears manage to push us down below this level, it would provide confirmation that further downside is highly probable.
- Next, we have the red line marking resistance at $45k levels.
- We have tested this region twice already this year, and failed to break and close above it.
- Thus, this level represents local resistance that we need to break and close above, in order to continue on with the bullish reversal.
- We're then faced with the resistance at $47.2k, which is Bitcoin's opening price for the 2022 yearly candle.
- The opening and closing prices of candles on the weekly, monthly, and yearly candles can play an important role as support or resistance.
- Taking this into account, if we were to break above $45k and close above those regions, it would be very likely for us to continue upwards and test $47.2k
- Then we have $53.7k, a key level of support-turned-resistance.
- We can see how important this level is, as the price dumped down to $42k immediately last year, when support at $53k broke.
- Thus, this is a key level of resistance that must be taken out before we can rally towards the $60k ranges.
Logical Approach Using Probabilities
- It's important to understand that predicting the market's future price action is impossible
- And timing the market, while possible, is extremely difficult.
- Thus, the best approach retail investors can take in understanding the market is one based on probabilities.
- "If X, then Y" is all you need to know.
- So for instance, applying this logic on the chart above, we would see something like this:
- "If Bitcoin breaks down below $40.7k, then we could expect further downside to new lower lows."
- "If Bitcoin breaks and closes above $45k, then we could expect it to test the yearly open resistance at $47.2k."
Conclusion
This market is difficult for old and new investors and traders alike. There are a lot of external factors combined - rate hikes, regional conflict, etc - that the market hasn't experienced yet. Bitcoin's price action is not extremely predictable at these levels, hence the best measured approach to take in understanding the market is to take it by levels. Identify key regions and levels of support and resistance, and look for confirmation and invalidation. In my personal opinion, I think that the bottom is either in, or that we're very close to the bottom. But until there's clear confirmation that we're out of the woods, I remain cautiously bullish.

🔥 Types of Analysis 📉 In trading and investing there are 2 t🔥 Types of Analysis
📉 In trading and investing there are 2 types of analysis a trader can make to have an edge and generate trading ideas.
📉 There is no such thing as technical analysis is better than fundamental or viceversa, personally i use fundamental analysis to understand what to buy or what to sell on a mid-long term perspective and technical analysis basically shows me when to enter the trade at a better price level.
‼️ Fundamental Analysis
• Using of the financial statements, news and events to generate trading ideas
• Mid-Long term approach
• Usually investors/traders use this for investing or position trading that could last for couple months
‼️ Technical Analysis
• Use chart, volume and price action
• Short-mid term approach
• Usually people use this for intra-day or intra-week moves
Which one you like more ?

Why 90% of Traders Lose ? ❌ Going Full Margin
Risk management is the most important in this game because it keeps you alive, keeps your account fresh during bad market conditions.
Learn risk management first to understand how to protect your capital first of all and then learn a strategy
You have to know your risk numbers in terms of
• Risk per trade
• Daily Drawdown Limit
• Weekly Drawdown Limit
• Monthly Drawdown Limit
✅ Buying SIGNALS
Buying signals and expecting overnight succes could be bad for your trading journey, don't expect anything from anybody and start to be your signal generator
✅ Get Rich Quickly
Trading business its not getting rich overnight, its getting rich for sure on a long term basis. Don't expect succes overnight its not gonna happen i promise you.
• Trading is a marathon, not a sprint. Give it time and simply commit to the process
✅ Not Sticking to the Plan
Your trading plan is your trading bible and principles, you should respect it no matter what. Your trading plan its the only thing you can control in the markets as you can't control the price movement.
Make the plan and trade the plan.
What do you think ?

USDT.D Daily Analysis🟢USDT's dominance bounced from the uptrend line support to form a twin floor pattern and is now above the neckline of this pattern, which also acts as a support. If the retest is successful, it is expected to move upwards, which will be a sign of decline for the market because the USDT and BTC dominance are inversely related to each other.
Use the appropriate loss limit for your trades, which has a very high possibility of emotional movement in the market.
⚠ This Analysis will be updated.
Amir Hossein
📅 02.19.2022
⚠️ (DYOR)

WHAT are Bitcoin cycles and WHY is it so important ✅❓What are bitcoin cycles and why is it so important❓
🚀This graph shows the entire history of bitcoin, approximately 13 years. If you open the logarithmic display of the chart, you can see some patterns in price behavior. Namely, that bitcoin moves in cycles. Which in turn are divided into an uptrend and a downtrend.
🎢Three complete cycles can be clearly seen on the chart. One cycle lasts four years on average. Of which 2.5 years of growth, and 1.5 years of decline. At the same time we would like to note that the cycles expand over time. But with the arrival of big money, institutional investors and various global companies, this pattern will be less and less noticeable (like the example of the S&P 500).
Why is bitcoin cyclical❓
The answer is actually very simple. It is only noticeable because bitcoin is in its early stage of development and acceptance. There are cycles in everything, it is a natural phenomenon.
🔋As examples:
- World cycles, every 10 to 12 years there is a crisis followed by a renewal and continued growth;
- Natural cycles, many examples of how the environment develops and renews;
- Our well-being, sometimes you have noticed that your mood and energy is at its highest when you are very productive and feel good, and vice versa, when it is at its lowest and you are less productive.
Markets are human creations, so they are also subject to natural behavior.
How can cycles help trading❓
✅Statistically, according to brokers and exchanges, 85-90% of traders are losing, 5-10% of traders are breaking even and only 5-7% of traders are earning. One of the most important tasks for any trader is to identify the right trend. Usually, when traders try to trade against the trend, they lose their trading accounts. That is why it is important to understand how to identify the trend and how to earn with the movement of the trend. This is where understanding bitcoin cycles helps. Some of our trading systems are based on these principles.
💚 Please like and subscribe to us to get more ideas like this.

Momentum in the Markets ✅✅✅✅ I will look at the momentum to understand if price has power to move towards my take profit area or no, a perfect scenario is when i enter a long or a short order the momentum should increase from candlestick to candlestick not decreasing, increasing momentum meaning that price has fuel and it is not exhausted.
🎯 Increasing momentum - bulls/bears has power, they have fuel to push price
🎯 Decreasing momentum - bulls/bears are losing power, they dont have fuel they are exhausted.
‼️ Take a look at this concept in HTF starting from H4 - MN
Kindly see the photos attached with bullish/bearish decreasing and increasing momentum.

Bitcoin/USD AnalysisThere are a cluster of lows around this area so price will most probably want to take out the lowest low before going higher.
This is due to traders stops being positioned under these lows so eventually the market will gravitate to these and take them out and possibly go lower to shake off retail traders, they can only "buy the dip" so many times before their account gets blown and they give up.
Thats when the market will go higher

Learn to trade Price Action with Blind Spot CBO setupAre you learning price action to trade bitcoin, gold?
In this post, we will learn about Blind Spot CBO setup
Blind Spot CBO includes:
- Clean Breakout (CBO) with candle like Mazubozu
- Strong Momentum
- Decision Point like Doji kink, Bearish/Bullish Engulf, ...
It's better when price comback after it made a clean breakout.
The downside of Blind Spot CBO is hard to find where we put our stop-loss (around 20-30 pips).
Do you want to see more post about trading Bitcoin, Gold ?

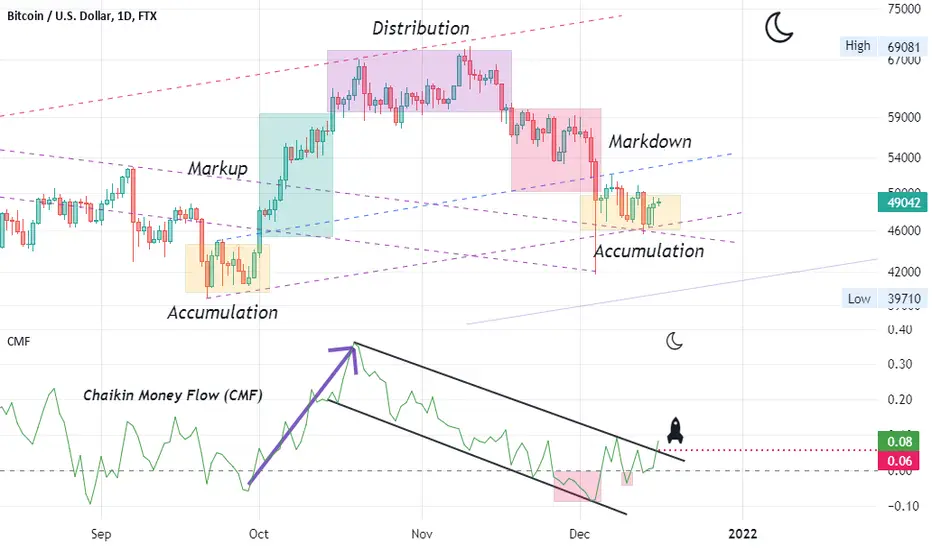
Accumulation and Distribution (based on CMF)
Hello friends:
It's the result of my efforts to offer a simple (using Graphical idea) presentation.
Concepts, I know you know ;)
Bullish: When demand is greater than supply, the price goes up
sideways: When demand is equal to supply, the price goes sideways
Bearish: When supply is greater than demand, the price goes up down
Chaikin Money Flow (CMF)
The main advantage of the CMF is that this indicator can assess the buying pressure vs the selling pressure.
1- Smart money is accumulating = increase CMF volume + candle closes near the top of its price
2- Distribution = decrease CMF volume + candle closes near the bottom of its price
Question: How is The Chaikin Money Flow Calculated ?
answer: it's not important (a bit complex!)
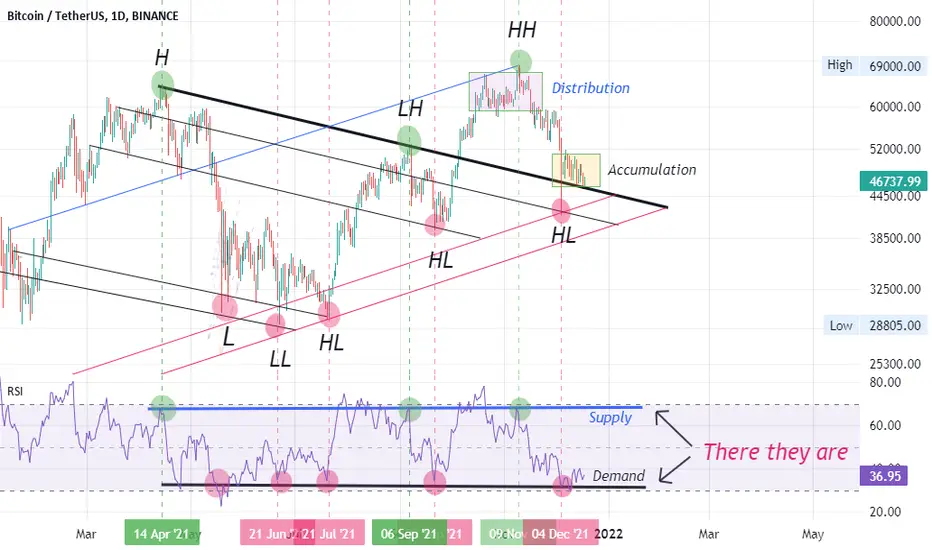
Accumulation & Distribution (Part 2- There they are)Hello friend,
What do you think of when you hear the phrase "Bitcoin Whales"?
Who Are Bitcoin Whales?
1- Institutions: money centre banks, hedge funds, Grayscale, Tesla ...
2- Exchanges: (6.7% of Bitcoin in circulation was held on exchange wallets),
3- Individuals: Elon Musk (also a Dogecoin Whale),..
4- Satoshi Nakamoto: first 1.8 million or so BTC first created, have never been spent.
How Do They Trade?
Let's start with the buy range, also known as the Demand zone.
Demand Zone:
1- When they are buying, they put their whole order (into the market) at once (strong price move- Pump)
2- They buy increments within a specified price range (Accumulation). (because the buying pressure would send the price sharply higher)
Supply Zone:
3- When they are selling their position, they put their whole order (into the market) at once (strong price move- Dump)
4- They sell over a period of time (Distribution).
Market Saturation :
Where selling and buying are out of balance (after Accumulation or Distribution)
5- Accumulation Zone- price goes up
6- Distribution Zone- price goes down
See attached Idea (Part 1).
reference:
twitter.com
Bitcoin's Market Cycle Explained Through Elliott WavesThis is an educational post on Elliott Impulse Wave structures, and how the theory can be applied to Bitcoin's chart, in order for us to identify the overall market trend.
Disclaimer: This is not investment advice. This is for educational and entertainment purposes only. I am not responsible for the profits or loss generated from your investments. Trade and invest at your own risk.
Basic Elliott Wave Structure
- 80% of the time, an Elliott Impulse Wave would have a structure as the diagram demonstrated above.
- After the first impulse wave, we have wave 2, which is a short term corrective wave, play out.
- Most of the time, the second wave demonstrates a zig zag pattern, in which we can count ABC waves.
- When the second wave is a zigzag, there's a high probability that the fourth wave demonstrates a complex correction, such as a double three (WXY), or a triple three (WXYXZ).
- Also, when the second wave is a zig zag pattern, there's a high probability that the length of the third wave is 1.618x of the first wave's length.
- In this case, there's also a high probability that the length of the fifth wave is equal to that of the first wave.
- Keep in mind that these are all probabilities. There are no rules set in stone that state that waves have to move a certain way, in a certain length, but they tend to demonstrate this structure under certain conditions
Bitcoin's Elliott Wave Structure
- However, as you can notice from Bitcoin's Elliott Wave count chart above, Bitcoin's second wave did not demonstrate a zig zag pattern.
- Instead, Bitcoin demonstrated a triple three (WXYXZ) leading to a sharp final drop caused by the Covid outbreak.
- When the second wave demonstrates a triple three pattern, there's a high probability that the fourth wave demonstrates a zig zag pattern.
- Also, when the second wave is a complex correction, there's a high probability that the third wave's length is 2.618x of the first wave's length.
- Additionally, when the second wave is a complex correction, there's a high probability that the final wave's length is 1.618x of the first wave's length.
Bitcoin Weekly Chart Elliott Wave Analysis
- Taking into consideration the Elliott Wave structures explained above, we can now see that Bitcoin's trend can be explained by the second diagram.
- We saw a complex correction (triple three, WXYXZ) pattern on Bitcoin's second wave.
- We're currently completing wave 4, which seems to be a running flat pattern (ABC).
- While this isn't exactly a zig zag pattern, it's a variation of the zig zag pattern, and part of the larger concept of simple corrections.
- For a more in-depth explanation on this corrective trend for the short term, make sure to check out my previous analysis by clicking the chart below:
Revealing My Secret Method: Technical Symmetry Analysis
Summary
I believe that there's an extremely high probability that Bitcoin's bull run isn't over. While December's price action may be rather disappointing, as we're in the process of completing the final corrective wave within a bigger impulse trend, we could expect a parabolic rally as we move towards Q1 of 2022. Using Elliott Waves isn't about accurately predicting the exact price and period of an asset's price action. While a lot of people try to correct each other on "wrong counts", unless the general rules are kept, there really isn't a strictly correct way or incorrect way of using this theory as a tool. In my opinion, Elliott Waves are best used on longer time frames, to identify the overall trend, and which point of the market cycle we are at.

MARKET STRUCTURE 🗒🗒🗒I am not the best painter, but i tried to show you the difference between the structure that we have in every market. And it doesnt depend if its crypto/stocks or forex everything is the same in terms of structure.
Trade in the direction of the HTF MARKET STRUCTURE.
Do you want more examples like that ? Comment below ..

BITCOIN DOMINANCE EXPLAINEDTo be successful in crypto you need to know how the market works and why it’s behaving like it is.
Bitcoin is the first ever cryptocurrency and will be the biggest a long time. This means that what bitcoin does will have a large impact on the market. But there are also times where every coin does it’s own thing.
Here is where Btc.d comes in.
Simply put, when bitcoin dominance is high, it means that almost every move is similar in the whole market. While when it’s low, we don’t need to worry too much about what bitcoin is doing if we see a good trade in some other coin.
We can take advantage of this!
Btc.d is surprisingly accurate with technical analysis. In the chart you can see two boxes where I would either buy bitcoin or altcoins.
You still have to find good setups and everything, but it gives a good indication of it’s either altcoins or bitcoins time to shine!
Good luck traders! Leave a like if you found this helpful <3

Channeling Bitcoin - Elliott Wave AnalysisTips and tricks on how to use channels in conjunction with Elliott Wave analysis to determine high probability targets and objectives.

How to Use the Bitcoin Dominance Chart to Maximize ProfitsIn this post, I'll be explaining a simple approach to the cryptocurrency market, and how you can refer to the Bitcoin Dominance Chart (BTC.D) to maximize profits.
Disclaimer: This is not investment advice. This is for educational and entertainment purposes only. I am not responsible for the profits or loss generated from your investments. Trade and invest at your own risk.
Bitcoin Dominance (BTC.D)
- Bitcoin Dominance is simply an indicator that demonstrates the percentage of Bitcoin's market cap relative to the entire market cap.
- When Bitcoin dominance is high, it indicates that Bitcoin's market cap is relatively larger compared to that of other altcoins, and vice versa.
- So when Bitcoin dominance rises, it could either indicate that:
- Bitcoin is rising at a faster pace than altcoins (during an uptrend)
- Altcoins are correcting at a faster pace than Bitcoin (during a downtrend).
- Vice versa, a drop in Bitcoin dominance could indicate that:
- Bitcoin is dropping at a faster pace than altcoins (during a downtrend)
- Or that altcoins are rising at a faster pace than Bitcoin (during an uptrend).
- Understanding this, you can refer to the Bitcoin dominance chart to rebalance your portfolio according to market situations.
Historical Price Action
- Above, I've marked Bitcoin's price action (black), relative to that of ETH (blue), which represents the overall altcoin market.
- The captions in the chart best explain the logic behind the price action, and how dominance is affected by it.
- What's important to understand is that the situation is relative: a high dominance does not necessarily indicate that buying altcoins is a good idea.
- It's important to understand the overall market cycle and structure to determine which regions are good entries.
Anatomy of a Market Cycle
- Above, we have the market cycle explained using Elliott Waves.
- The market never moves in straight lines: It goes through phases of impulse waves, and corrective waves.
- Elliott Waves also have very strict rules that must be kept.
- Or else, the wave count is considered negated.
- Here are the rules:
- Waves 1,3 and 5 are always with the trend
- Waves 2,4 are always against the trend
- Wave 2 can never drop below wave 1’s low
- Wave 3 can never be the smallest wave
- Wave 4 can never drop into the range of wave 2 (unless it is part of a diagonal)
- With this in mind, we can now take a look at where Bitcoin is, from the larger wave count.
Bitcoin Market Cycle using Elliott Waves
- We can start counting the wave from $3.1k, when Bitcoin bottomed out around the end of 2018
- Based on this wave count, it could be said that the move up to $64k was the end of the 3rd impulse wave.
- We have recently completed the 4th corrective wave, and are on our way to complete the 5th impulse wave.
- As to why I have selected the $200k region and June 2022 as my price and time period target, please refer to my previous analysis below:
Conclusion
Bitcoin dominance is currently forming a double bottom on the weekly. With Bitcoin's wave count lining up for an impulse move upwards, I expect Bitcoin to rally upwards, outperforming other altcoins in the short-mid term. As Bitcoin paves way for the entire crypto market cap by breaking through all time high levels in Q4, we could see Bitcoin dominance reach resistance around the 60-70% range. At that point, given that the broader market cycle isn't over, it would be a good point adjust your portfolio, and scale profits from Bitcoin into altcoins for maximum returns.
If you like this educational post, please make sure to like, and follow for more quality content!
If you have any questions or comments, feel free to comment below! :)

BITCOIN IN PERSPECTIVE How many times have you heard that bitcoin is very expensive? How many times have you heard that Bitcoin is a Ponzi scheme?
PERSPECTIVE. That is what is needed to combat some of the myths that surround this cryptocurrency, which will probably take part in the digital economy.
Regarding the first question, is $1T too much capitalization for a finite, decentralized and immutable asset, which could gradually update our entire economy? I do not think so.
Could a Ponzi scheme hold 1% of all global currency for more than a decade? I do not think so.
So is Bitcoin too expensive from a macroeconomic perspective? I do not think so.
Before you buy Bitcoin. What are your reasons?
A decision without a plan is guided by emotions.
Profitability and emotions don't get along very well.
Perspective.
See you later.

CONSENSUS MECHANISMS - PoW vs PoSHey, Alkalites! If you want to invest in cryptocurrencies and know how to recognize long-term opportunities, you should start learning the technology behind them.
Do you know what a consensus mechanism is?
Consensus decision-making is a process in which group members agree to support a decision in the best interest of the whole.
In other words, this mechanism is used to govern the blockchain behind each asset. Usually, this consensus is necessary to confirm the validity of the transactions that take place in that network.
The most common consensus mechanisms are PoW (Proof of Work) and PoS (Proof of Stake).
PoW is used to determine how the network can be sure that the transaction is valid and that someone is not corrupting the network, for example, with double-spending. The Proof of Work is based on advanced mathematical formulas called “cryptography”. That is why the name "cryptocurrency" was invented.
All miners compete looking for a solution to the mathematical problem. The first miner (or pool of miners) to solve the block problem receives a reward, the block is created and transactions are included. Examples are BTC and ETH.
PoS uses a process by which contributors to the system earn commissions from transactions. To validate the transactions, the user must put their coins in a wallet that freezes the coins. The more you stake, the more you earn.
If someone tried to hack the network or process malicious transactions, he would lose all of his participation, since it would affect the integrity of his wallet. Also, it encourages holding the tokens, which is good for the value. Examples are Algorand and Cardano.
Do you have any question? Let me know!
Have a great Sunday, Alkalites!

THE TREND IS YOUR FRIEND,BUT HOW TO ACCURATELY DETERMINE THE WINMany of us have been taught that the trend is our friend and we should trade in the direction of the trend.As we have eventually discovered this is easier said than done.I am a Mechanical Engineer by profession so i was inclined to find an excellent way to determine the trend of a market,forex currency pair, cryptocurrency pair or a stock.

Bitcoin Wyckoff [Accumulation & Distribution] — ⚠️Possible 24000This trading method was developed by Richard Wyckoff in the early 1930s. It consists of a series of principles and strategies originally designed for traders and investors. Wyckoff devoted much of his life to studying market behaviour, and his work still influences much of modern technical analysis (TA).
Currently, the Wyckoff method is applied to all types of financial markets, although it was originally focused only on stocks, but I find it amazingly good on cryptocurrency market and Bitcoin
During the creation of his work, Wyckoff was inspired by the trading methods of other successful traders (especially Jesse L. Livermore). Today he is in the same respect as other key figures such as Charles H. Doe and Ralph N. Elliott.
Wyckoff's Three Laws
The law of supply and demand
The first law states that the value of assets begins to rise when demand exceeds supply, and accordingly falls in the opposite order. This is one of the most basic principles in the financial markets, which does not exclude Wyckoff in his works. We can represent the first law as three simple equations:
Demand > Supply = Price Increases
Demand < Supply = Price Falls
Demand = supply = no significant price change (low volatility)
In other words, Wyckoff's First Law assumes that the excess of demand over supply leads to higher prices, since there are more buyers than sellers. But in a situation where there are more sales than purchases, and supply exceeds demand, it indicates a further drop in value.
Many investors who use the Wyckoff method correlate price movement with bar volume as a way to better visualize the relationship between supply and demand. This often helps to predict the future movement of the market.
Personally I recommend use higher timeframes and indicators like ADL and Stochastic RSI.
The law of cause
The second law states that the differences between supply and demand are not coincidences. Instead, they reflect preparatory actions as a result of certain events. In Wyckoff's terminology, the accumulation period (cause) ultimately leads to an uptrend (effect). In turn, the distribution period (reason) provokes the development of a downtrend (consequence).
Wyckoff used a unique technique of plotting patterns on charts to assess the potential consequences for specific causes. In other words, he created methods for determining trading targets based on periods of accumulation and distribution. This allowed him to assess the likely expansion of the market trend after exiting the consolidation zone or trading range (TR).
The Law of the Connection of Efforts and Results
Wyckoff's Third Law states that changes in price are the result of total effort that is reflected in trading volume. In the case when the growth of the asset value corresponds to the high trading volume, there is a high probability that the trend will continue its movement. But if the volumes are too small at a high price, the growth will most likely stop and the trend may change its direction.
For example, let's imagine that the bitcoin market starts to consolidate with very high volume after a long bearish trend. High trading volumes indicate more demand, but sideways movement (low volatility) suggests little outcome. If a large number of bitcoins change hands and the price does not fall significantly, this may indicate that the downtrend may end and there will soon be a reversal.
To sum up, the Wyckoff Method allows investors to make smarter and more logical decisions without relying on their emotional state. His extensive work provides traders and investors with a range of tools to reduce risk and increase their chances of success. However, there is no single, reliable methodology when it comes to investment. You should always approach all trades with caution and take into account all potential risks, especially in the highly volatile cryptocurrency market.
Best regards
Artem Shevelev

Continuation Chart Patterns - Falling WedgeHello guys, this is an additional Tutorial idea following the previous one.
You can also use this trick to read your chart if you want to make sure if it's bullish or not. It's called a Falling Wedge.
What is a Falling Wedge?
When this pattern is found in an uptrend, it is considered a bullish pattern, as the market range becomes narrower into the correction, indicating that the downward trend is losing strength and the resumption of the uptrend is in the making.
"The falling wedge pattern is characterized by a chart pattern which forms when the market makes lower lows and lower highs with a contracting range. When this pattern is found in a downward trend, it is considered a reversal pattern, as the contraction of the range indicates the downtrend is losing steam. When this pattern is found in an uptrend, it is considered a bullish pattern, as the market range becomes narrower into the correction, indicating that the downward trend is losing strength and the resumption of the uptrend is in the making."
Now let's talk...
Have you used this patterns? What are your experiences?
Any tricks you got in mind so that we can improve reading charts based on it?
Comment below!

🚀 Lesson From A ProOnce a trader from a large forex trading desk explained his main trading daily routine.
He started his day placing a large order to test the closest price resistance, waiting for the market to react. If the market moved in the direction of his trade, he was happy with a nice profit. On the other hand, if the resistance proved to be solid, he would have closed the previous trade with a small loss and opened a new one of double the size in the other direction. Eventually, the profit could have been even larger.
No matter what asset class you are trading, the basic principles of demand and supply are always the leading indicators to understand where the trend is heading next.
Looking at Bitcoin's chart, this applies perfectly. The price has been moving with relatively low volatility for over one week now. The moves may seem random, but they make a lot of sense at a closer look. The price tends to consolidate into tight ranges, which are tested frequently. Once a breakout occurs and fails, that is the signal that it will likely move in the opposite direction.
Once you break out the price action into blocks, it becomes easier to understand how supply and demand are distributing.
Remember, the price eventually chases liquidity, so take your position in the direction of the liquidity areas, and plan your risk management accordingly.
Trading such choppy market conditions may be stressful and frustrating. The good news is that automated trading may add more value to your portfolio, especially in these times.
