Advantages of Haiken Ashi over traditional candles [CRYPTO]Haiken Ashi candles are a very popular type of charts used in Forex trading. Unlike traditional Japanese candles, the Haiken Ashi chart uses a special algorithm to process the price data, which makes it easier to read trends and market direction.
Benefits:
What are the benefits of using Haiken Ashi candles? First of all, such charts allow us to detect market trends more clearly and easily read. In addition, Haiken Ashi charts allow us to more easily determine entry and exit points of positions, as well as determine stop loss and take profit.
Construction of Haiken Ashi candles:
Let's start by defining what Haiken Ashi candles actually are. These candles differ from traditional Japanese candles in many ways. First of all, in Haiken Ashi charts, the opening price of each new candle is the average of the opening and closing prices of the previous candle. The closing price, on the other hand, is the average of four values: the opening price, the closing price, the highest price and the lowest price. As a result, the opening and closing price of subsequent candles lags behind traditional Japanese candles.
Advantages of Haiken Ashi:
How can we use Haiken Ashi candles in Forex trading? First of all, it allows us to detect market trends more clearly and easily read. As a result, we can more easily determine entry and exit points for positions, and determine stop loss and take profit.
Strategies:
Trend strategy - involves using Haiken Ashi candles to identify market trends. For an uptrend, we wait for a series of green candles to appear, while for a downtrend, we wait for a series of red candles to appear. Once the trend is identified, we can open a position according to its direction.
Double candlestick strategy - involves waiting for the occurrence of two consecutive Haiken Ashi candles of opposite colors. When a red candle is followed by a green candle, this is a buy signal. On the other hand, when a green candle is followed by a red candle, it is a sell signal.
Inner candle strategy - involves waiting for the appearance of the Haiken Ashi candle, the body of which is completely contained in the body of the previous candle. When such a situation occurs, we can open a position according to the direction of the trend.
Reversal candle strategy - consists in waiting for the appearance of a long red candle after a series of green candles or a long green candle after a series of red candles. The appearance of such a candle may indicate a reversal of the trend, which gives a signal to open a position against the existing trend.
In conclusion, Haiken Ashi candles are a tool that can be very useful in Forex technical analysis. With this tool, we can more easily detect market trends, determine entry points.
On the other hand, Haiken Ashi candles are an addition to a set of various indicators for technical analysis. In our Manticore Invesmtents Scalping strategy, we combine Haiken Ashi candles with a strategy based on RSI and Bollinger Bands.
In the next parts of the tutorials, let's describe the use of RSI and BB.
Candlestickpattern

Advantages of Haiken Ashi over traditional Japanese candlesHaiken Ashi candles are a very popular type of charts used in Forex trading. Unlike traditional Japanese candles, the Haiken Ashi chart uses a special algorithm to process the price data, which makes it easier to read trends and market direction.
Benefits:
What are the benefits of using Haiken Ashi candles? First of all, such charts allow us to detect market trends more clearly and easily read. In addition, Haiken Ashi charts allow us to more easily determine entry and exit points of positions, as well as determine stop loss and take profit.
Construction of Haiken Ashi candles:
Let's start by defining what Haiken Ashi candles actually are. These candles differ from traditional Japanese candles in many ways. First of all, in Haiken Ashi charts, the opening price of each new candle is the average of the opening and closing prices of the previous candle. The closing price, on the other hand, is the average of four values: the opening price, the closing price, the highest price and the lowest price. As a result, the opening and closing price of subsequent candles lags behind traditional Japanese candles.
Advantages of Haiken Ashi:
How can we use Haiken Ashi candles in Forex trading? First of all, it allows us to detect market trends more clearly and easily read. As a result, we can more easily determine entry and exit points for positions, and determine stop loss and take profit.
Strategies:
Trend strategy - involves using Haiken Ashi candles to identify market trends. For an uptrend, we wait for a series of green candles to appear, while for a downtrend, we wait for a series of red candles to appear. Once the trend is identified, we can open a position according to its direction.
Double candlestick strategy - involves waiting for the occurrence of two consecutive Haiken Ashi candles of opposite colors. When a red candle is followed by a green candle, this is a buy signal. On the other hand, when a green candle is followed by a red candle, it is a sell signal.
Inner candle strategy - involves waiting for the appearance of the Haiken Ashi candle, the body of which is completely contained in the body of the previous candle. When such a situation occurs, we can open a position according to the direction of the trend.
Reversal candle strategy - consists in waiting for the appearance of a long red candle after a series of green candles or a long green candle after a series of red candles. The appearance of such a candle may indicate a reversal of the trend, which gives a signal to open a position against the existing trend.
Veiling candle strategy - involves waiting for the appearance of a large Haiken Ashi candle, the body of which completely obscures the body of the previous candle. In this case, we can open a position according to the direction of the trend.
In conclusion, Haiken Ashi candles are a tool that can be very useful in Forex technical analysis. With this tool, we can more easily detect market trends, determine entry points.
On the other hand, Haiken Ashi candles are an addition to a set of various indicators for technical analysis. In our Manticore Invesmtents Scalping strategy, we combine Haiken Ashi candles with a strategy based on RSI and Bollinger Bands.
In the next parts of the tutorials, let's describe the use of RSI and BB.

💥 Bullish VS Bearish Candlesticks📍Bullish and bearish candlestick patterns are technical analysis tools used by traders to identify potential market trends and reversals. Bullish patterns indicate a potential rise in the price of an asset, while bearish patterns indicate a potential decline in price.
🔷 Bullish candlestick patterns include the dragonfly doji, hammer, tweezer bottom, morning star engulfing and three white soldiers. These patterns suggest that buying pressure is increasing and that there may be a potential for a trend reversal.
🔷 Bearish candlestick patterns include the gravestone doji, inverted hammer, tweezer top three black crows and more. These patterns suggest that selling pressure is increasing and that there may be a potential for a trend reversal.
🔷When using candlestick patterns for trading, it's important to look for confluence with other signals, such as trend lines, support and resistance levels, and other technical indicators. Combining multiple signals can provide a stronger indication of potential market movements and help traders make more informed trading decisions.
🔷It's also important to note that candlestick patterns should not be relied on as the sole indicator for trading decisions, as they are not always accurate and can produce false signals. Traders should always use a combination of technical analysis tools and fundamental analysis when making trading decisions. This is why its important to create and monitor your own strategy and backtest what works and what doesn't.
👤 @AlgoBuddy
📅 Daily Ideas about market update, psychology & indicators
❤️ If you appreciate our work, please like, comment and follow ❤️

📊 The Doji Candle Pattern📍What is the Doji Candlestick Pattern?
The Doji Candlestick Pattern refers to a chart pattern consisting of a single candle. This pattern appears when the opening and closing prices of a candle are nearly the same or identical, resulting in a small-bodied candle with upper and lower wicks resembling a "+". Different variations of Doji patterns exist, with unique names like the Long-legged Doji, Gravestone Doji, Dragonfly Doji, and Doji star candlestick pattern. Regardless of the type, all Doji patterns provide traders with four critical data points: the open, close, high, and low prices for the given period. Doji patterns can occur on any timeframe and in any market, making them the foundation of many trading strategies
🔹Long-legged Doji
The Long-legged Doji pattern has an elongated upper and lower wick and a small body
The Long-legged Doji can be interpreted in several ways and works best when viewed in context with price action. It is a potential price reversal signal in a defined up or downtrend. If it occurs in a flat market, it suggests further consolidation.
🔹Dragonfly Doji
The Dragonfly Doji sets up when the candle’s open, close, and high is approximately the same. Visually, the Dragonfly looks like a “T,” as depicted in the image below. This formation suggests that heavy selling was present, but the market has rebounded. As a general rule, the Dragonfly is considered a reversal indicator. A retracement in price is expected when it occurs at the top of a bullish trend.
🔹Gravestone Doji
The Gravestone Doji pattern is the polar opposite of the Dragonfly; it appears as an inverted “T” and signals that heavy buying has given way to selling. The Gravestone Doji is a reversal chart pattern that signals downward or upward pressure may be on the way. The Gravestone suggests that a reversal is possible when observed within a defined uptrend. Within a downtrend, bullish price action may be forthcoming.
🔸Reversals
Doji candlesticks can be a great way to get in or out of the market in trending markets. The Gravestone and Dragonfly are ideal for reversal strategies as they indicate forthcoming upward and downward movements in price.
🔸Breakouts
One of the lowest-risk ways to utilize Dojis in the FX market is to trade breakouts. A breakout is a sudden directional move in price. Dojis often precede breakouts, as they are a signal of indecisiveness. As soon as the market makes up its mind, a significant move may be in the offing.
👤 @AlgoBuddy
📅 Daily Ideas about market update, psychology & indicators
❤️ If you appreciate our work, please like, comment and follow ❤️

🔎 A Look Inside The Candlestick Chart📍What Is a Candlestick?
The formation of the candle is essentially a plot of price over a period of time. For this reason, a one minute candle is a plot of the price fluctuation during a single minute of the trading day. The actual candle is just a visual record of that price action and all of the trading executions that occurred in one minute.
[b📍Who Discovered the Idea of Candlestick Patterns?
It is commonly believed that candlestick charts were invented by a Japanese rice futures trader from the 18th century. His name was Munehisa Honma.
Honma traded on the Dojima Rice Exchange of Osaka, considered to be the first formal futures exchange in history.
As the father of candlestick charting, Honma recognized the impact of human emotion on markets. Thus, he devised a system of charting that gave him an edge in understanding the ebb and flow of these emotions and their effect on rice future prices.
📉Bearish Candle
🔹 Open Price: A bearish candlestick forms when the opening price of a currency pair is higher than the closing price of the previous candlestick.
🔹 High and Low Price: During the candlestick's time frame, the price moves higher than the opening price and then declines to form a lower low than the previous candlestick.
🔹 Body: The body of the bearish candlestick is colored red and represents the difference between the opening and closing price. The longer the body of the candlestick, the stronger the bearish sentiment.
🔹 Upper Shadow: The upper shadow of the candlestick represents the highest price achieved during the candlestick's time frame. The longer the upper shadow, the greater the bearish pressure.
🔹 Lower Shadow: The lower shadow of the candlestick represents the lowest price achieved during the candlestick's time frame. The shorter the lower shadow, the stronger the bearish sentiment.
📈Bullish Candle
🔹 Open Price: A bullish candlestick forms when the opening price of a currency pair is lower than the closing price of the previous candlestick.
🔹 High and Low Price: During the candlestick's time frame, the price moves lower than the opening price and then rises to form a higher high than the previous candlestick.
🔹 Body: The body of the bullish candlestick is colored green and represents the difference between the opening and closing price. The longer the body of the candlestick, the stronger the bullish sentiment.
🔹 Upper Shadow: The upper shadow of the candlestick represents the highest price achieved during the candlestick's time frame. The shorter the upper shadow, the greater the bullish pressure.
🔹 Lower Shadow: The lower shadow of the candlestick represents the lowest price achieved during the candlestick's time frame. The longer the lower shadow, the greater the bullish sentiment.
👤 @AlgoBuddy
📅 Daily Ideas about market update, psychology & indicators
❤️ If you appreciate our work, please like, comment and follow ❤️

What is Candlestick Pattern?Candlestick patterns are a charting technique used by traders to analyze the price movement of financial instruments. They originated in Japan in the 18th century and were used to track the price of rice. The technique was later adapted for trading other assets like stocks, currencies, commodities, and cryptocurrency.
Candlestick patterns are an important tool used by traders and investors to analyze the price movement of financial assets. A candlestick is a visual representation of the price movement of an asset during a specific time period. Each candlestick represents the opening, closing, high, and low prices of the asset during the period. The shape and color of the candlestick provide important information about the price movement of the asset.
Candlestick patterns are formed by the combination of one or more candlesticks, and they can indicate a potential trend reversal, continuation, or indecision in the market. Some candlestick patterns are based on just one candlestick, while others are based on combinations of two or more candlesticks.
A bearish candle (red candle) represents a period of trading where the closing price is lower than the opening price. This indicates that sellers were able to push the price down, indicating a negative sentiment in the market. The bearish candle has a long body and a small lower wick, indicating that sellers were in control for most of the trading period.
A bullish candle (green candle) represents a period of trading where the closing price is higher than the opening price. This indicates that buyers were able to push the price up, indicating a positive sentiment in the market. The bullish candle has a long body and a small upper wick, indicating that buyers were in control for most of the trading period.
Both bullish and bearish candles can come in various sizes and shapes, indicating different levels of buying or selling pressure. For example, a long bullish candle with no or a very small upper shadow could indicate strong buying pressure, while a short bullish candle with a long upper wick could indicate weaker buying pressure.
Different types of candlesticks Pattern:
1. Bullish Candlestick Pattern
- Hammer
- Inverse Hammer
- Bullish Harami
- Bullish Engulfing
- Morning Star
- Three white soldiers
2. Bearish Candlestick Pattern
- Shooting star
- Hanging man
- Bearish Harami
- Bearish Engulfing
- Evening star
- Three black crows
Doji: Gravestone Doji
Dragonfly Doji
Long-legged Doji ( Spinning top )
In the upcoming post, we will elaborate on the various types of candlesticks and how to use them.
Thanks
Hexa

📊 Candlestick CheatsheetCandlestick charts are commonly used in trading to analyze market trends and make trading decisions. Candlesticks can be categorized as bullish or bearish, depending on whether the price has increased or decreased over a given period.
It is important to note that while candlestick patterns can be useful in predicting market movements, they should not be used in isolation, and other indicators and analysis should also be considered. It is also important to have a clear understanding of the market and its underlying fundamentals before making any trading decisions.
🔹 Rails
The rails pattern is a two-candlestick pattern that typically occurs during a downtrend. The first candle is a long red candle, followed by a long green candle that opens below the previous day's close but closes above it, creating a rail-like pattern.
🔹 Three White Soldiers
The three white soldiers pattern is a bullish pattern that consists of three consecutive long green candles with small or no wicks. It typically occurs after a downtrend and suggests a reversal in the market's direction.
🔹 Three Black Crows
The three black crows pattern is a bearish pattern that consists of three consecutive long red candles with small or no wicks. It typically occurs after an uptrend and suggests a reversal in the market's direction.
🔹 Mat Hold
The mat hold pattern is a five-candlestick pattern that occurs during a bullish trend. It consists of a long green candle, followed by three small candles with lower highs and higher lows, and ending with another long green candle.
🔹 Pinbar
The pinbar pattern is a single candlestick pattern that has a long tail or wick and a small body. The tail should be at least two times the length of the body. The pattern suggests a reversal in the market's direction.
🔹 Engulfing
The engulfing pattern is a two-candlestick pattern that occurs when the second candle's body completely engulfs the previous candle's body. A bullish engulfing pattern occurs during a downtrend and suggests a reversal in the market's direction, while a bearish engulfing pattern occurs during an uptrend and suggests a reversal in the market's direction.
🔹 Morning Star
The morning star pattern is a three-candlestick pattern that typically occurs after a downtrend. It consists of a long red candle, a small candle, and a long green candle, with the small candle gapping down from the previous day's close. The pattern suggests a reversal in the market's direction.
🔹 Evening Star
The evening star pattern is the opposite of the morning star pattern and typically occurs after an uptrend. It consists of a long green candle, a small candle, and a long red candle, with the small candle gapping up from the previous day's close. The pattern suggests a reversal in the market's direction.
👤 @algobuddy
📅 Daily Ideas about market update, psychology & indicators
❤️ If you appreciate our work, please like, comment and follow ❤️

The Three Black Crows PatternThe Three Black Crows or as otherwise known Three Soldiers are a formation of price continuation showing how the bears are taking control over the bulls to reverse the trend as we can see here.
Price comes down buyers try to push it back up only to be reversed by sellers overpowering them so it falls back down the buyers try again but realise the bear is the almighty and with that last attempt they withdraw from the market causing a big sell off with a strong downward movement when just the bears remain
key points:
- last attempt of the bulls
- price goes up and bears push price down every time
- bears in control after a long uptrend shows prelude to sell

Candlestick Reversal Patterns of Technical Analysis !!!👨🏫 In this post, I tried to show you the most important Candlestick Reversal Patterns of Technical Analysis with Entry points & Stop loss points . you can use these patterns for Triggers of your traders at any timeframe ⏰ (These patterns are more valid at higher timeframes).
Please do not forget the ✅ 'like' ✅ button 🙏😊 & Share it with your friends, Thanks, and Trade safe.
What Is A Candlestick ❗️❓
A candlestick is a type of price chart used in technical analysis that displays the high, low, open, and closing prices of a security for a specific period. It originated from Japanese rice merchants and traders to track market prices and
daily momentum for hundreds of years before becoming popularized in the United States. The wide part of the candlestick is called the "real body" and tells investors whether the closing price was higher or lower than the opening price
(black/red if the stock closed lower, white/green if the stock closed higher).
Bullish Pattern 🌅:
🟢 Hammer Pattern : A hammer is a price pattern in candlestick charting that occurs when a security trades significantly lower than its opening, but rallies within the period to close near the opening price. This pattern forms a hammer-shaped candlestick, in which the lower shadow is at least twice the size of the real body. The body of the candlestick represents the difference between the open and closing prices, while the shadow shows the high and low prices for the period.
🟢 Inverted Hammer Pattern : The inverted hammer candlestick pattern (or inverse hammer) is a candlestick that appears on a chart when there is pressure from buyers to push an asset’s price up. It often appears at the bottom of a downtrend, signaling a potential bullish reversal. The inverted hammer pattern gets its name from its shape – it looks like an upside-down hammer. To identify an inverted hammer candle, look out for a long upper wick, a short lower wick, and a small body.
🟢 Bullish Engulfing Pattern : A bullish engulfing pattern is a white candlestick that closes higher than the previous day's opening after opening lower than the previous day's close. It can be identified when a small black candlestick, showing a bearish trend, is followed the next day by a large white candlestick, showing a bullish trend, the body of which completely overlaps or engulfs the body of the previous day’s candlestick. A bullish engulfing pattern may be contrasted with a bearish engulfing pattern.
🟢 Bullish Piercing Line Pattern : A piercing pattern is a two-day, candlestick price pattern that marks a potential short-term reversal from a downward trend to an upward trend. The pattern includes the first day opening near the high and closing near the low with an average or larger-sized trading range. It also includes a gap down after the first day where the second day begins trading, opening near the low and closing near the high. The close should also be a candlestick that covers at least half of the upward length of the previous day's red candlestick body.
🟢 Bullish Harami Pattern : The Bullish Harami candle pattern is a reversal pattern appearing at the bottom of a downtrend. It consists of a bearish candle with a large body, followed by a bullish candle with a small body enclosed within the body of the prior candle. As a sign of changing momentum, the small bullish candle ‘gaps’ up to open near the mid-range of the previous candle. The opposite of the Bullish Harami is the Bearish Harami and is found at the top of an uptrend.
🟢 Morning Star Pattern : A morning star is a visual pattern consisting of three candlesticks that are interpreted as bullish signs by technical analysts. A morning star forms following a downward trend and it indicates the start of an upward climb. It is a sign of a reversal in the previous price trend. Traders watch for the formation of a morning star and then seek confirmation that a reversal is indeed occurring using additional indicators.
🟢 Three White Soldiers Pattern : Three white soldiers is a bullish candlestick pattern that is used to predict the reversal of the current downtrend in a pricing chart. The pattern consists of three consecutive long-bodied candlesticks that open within the previous candle's real body and a close that exceeds the previous candle's high. These candlesticks should not have very long shadows and ideally open within the real body of the preceding candle in the pattern.
Bearish Patterns 🌄:
🔴 Hanging Man Pattern : The hanging man is a type of candlestick pattern. Candlesticks display the high, low, opening, and closing prices for a security for a specific time frame. Candlesticks reflect the impact of investors' emotions on security prices and are used by some technical traders to determine when to enter and exit trades. The term "hanging man" refers to the candle's shape and what the appearance of this pattern infers. The hanging man represents a potential reversal in an uptrend. While selling an asset solely based on a hanging man pattern is a risky proposition, many believe it's a key piece of evidence that market sentiment is beginning to turn. The strength in the uptrend is no longer there.
🔴 Shooting Star Pattern : A shooting star is a bearish candlestick with a long upper shadow, little or no lower shadow, and a small real body near the low of the day. It appears after an uptrend. Said differently, a shooting star is a type of candlestick that forms when a security opens, advances significantly, but then closes the day near the open again. For a candlestick to be considered a shooting star, the formation must appear during a price advance. Also, the distance between the highest price of the day and the opening price must be more than twice as large as the shooting star's body. There should be little to no shadow below the real body.
🔴 Bearish Engulfing Pattern : A bearish engulfing pattern is a technical chart pattern that signals lower prices to come. The pattern consists of an up (white or green) candlestick followed by a large down (black or red) candlestick that eclipses or "engulfs" the smaller up candle. The pattern can be important because it shows sellers have overtaken the buyers and are pushing the price more aggressively down (down candle) than the buyers were able to push it up (up candle).
🔴 Bearish Dark Cloud Cover Pattern : Dark Cloud Cover is a bearish reversal candlestick pattern where a down candle (typically black or red) opens above the close of the prior up candle (typically white or green), and then closes below the midpoint of the up candle. The pattern is significant as it shows a shift in the momentum from the upside to the downside. The pattern is created by an up candle followed by a down candle. Traders look for the price to continue lower on the next (third) candle. This is called confirmation.
🔴 Bearish Harami Pattern : A bearish harami is a two-bar Japanese candlestick pattern that suggests prices may soon reverse to the downside. The pattern consists of a long white candle followed by a small black candle. The opening and closing prices of the second candle must be contained within the body of the first candle. An uptrend precedes the formation of a bearish harami.
🔴 Evening Star Pattern : An evening star is a stock-price chart pattern used by technical analysts to detect when a trend is about to reverse. It is a bearish candlestick pattern consisting of three candles: a large white candlestick, a small-bodied candle, and a red candle. Evening star patterns are associated with the top of a price uptrend, signifying that the uptrend is nearing its end. The opposite of the evening star is the morning star pattern, which is viewed as a bullish indicator.
🔴 Three Black Crows Pattern : Three black crows is a phrase used to describe a bearish candlestick pattern that may predict the reversal of an uptrend. Candlestick charts show the day's opening, high, low, and closing prices for a particular security. For stocks moving higher, the candlestick is white or green. When moving lower, they are black or red. The black crow pattern consists of three consecutive long-bodied candlesticks that have opened within the real body of the previous candle and closed lower than the previous candle. Often, traders use this indicator in conjunction with other technical indicators or chart patterns as confirmation of a reversal.

6 Reliable Bullish Candlestick PatternHello dear traders,
Here are some educational chart patterns that you must know in 2022 and 2023.
I hope you find this information educational and informative.
We are new here so we ask you to support our views with your likes and comments,
Feel free to ask any questions in the comments, and we'll try to answer them all, folks.
6 Reliable Bullish Candlestick Pattern
1) The Hammer
2) Bullish Engulfing Crack
3) Bearish Engulfing Sandwich
4) Morning Star
5) Tweezer Bottom
6) Piercing Line
1. The Hammer:-
Hammer is a bullish candlestick reversal candle.
Which is formed within the next few candles. As the price declines sharply, we anticipate a final bounce.
But how can we estimate without falling into overselling?
That's where Hammer comes into play. This gives us evidence that the selling pressure is subsiding or being absorbed. Furthermore, if the volume signature associated with the hammer candle is significant, it adds even more confidence to our thesis.
We are looking to cash in on shorts who are taking profits and covering, as well as dip buyers who are taking chances here on oversold positions. Expectation? an assembly.
Ideally, you identify a hammer candle, take a long position on a break on the upside of the candle, and set risk on the low or in the body of the hammer.
Bullish Hammer Example;-
Let’s look at a real-life example with BTC. Right off the open, BTC retests the lows from the pre-market. Once it reaches those levels, volume increases slightly as it reverses on the 5-minute chart seen here.
Visibly, there is a “shelf” forming near the low of the hammer candle’s body. The bar to the left and right is also closed and open in that price “shelf” area.
The second 5-minute chart opens with a bit of weakness, then rallies strongly above the Hammer candle.
This is your signal to go long. The break of the Hammer candle body.
Set the stop below the close of this bullish 5-minute candle.
2. Bullish Engulfing Crack:-
You can imagine that shorts will start covering given the rising price of the stock. This adds fuel to the already existing buying pressure.
The result is a bullish candlestick pattern that swallows up the bears' efforts. For the long-biased trader, the opportunity is perfect.
As is the case with any setup, we are looking for evidence to sway our confidence in either direction. The fact that the bears completely got away in this single bar is proof enough for us.
You go long on the break of the previous bar and set the stop on the low.
Bullish Engulfing Examples:-
Here's a snapshot of BTC, which provided us with a beautiful opening range breakout (ORB) opportunity right out of the gate on this particular day:
After the selloff, buyers come in and remove the selling pressure from the pre-market, engulfing the bears before moving up.
To be safe, you enter long when the red candle breaks, setting your risk at the low level or body of the first green candle.
There are some advanced traders who are more aggressive and may take their positions early if they feel a reversal is imminent.
3. Bearish Engulfing Sandwich:-
do not be confused. Just because the name says "bearish" doesn't mean it's a bearish pattern. Far from it, actually. It is often referred to as a stick sandwich.
The name is derived from the sandwiching of a "bearish engulfing" candle by two bullish candles. Thus, it is a bullish candlestick pattern in this context.
Similar to the above example of a Bullish Engulfing Crack, this pattern takes a bit longer to "move through" so to speak. Essentially an extra bar.
The perception is that the trend has reversed and we are now going down. After all, the bearish engulfing candle gives us that confidence,
If you're on the smaller side, there's hope. However, stocks don't always do what we want them to. We have to react to what the market gives us, not what we think should happen.
In this case, the Bearish Engulfing Crack is used by two bullish candles that move upwards. If you are short, hopefully, you have respected your stop loss. If you are a long-time bias, here is a good opportunity for you.
Bearish Engulfing Sandwich Example:-
After opening with a 5-minute candle chart, BTC gives a great view of it in real-time.
In this case, the right side of the sandwich acts similarly to the Bullish Engulfing Crack candlestick pattern. For all intents and purposes, you should treat your entries and risk according to the same pattern.
4. The Morning Star:-
Morning Star should gap down. It's difficult to find on an intraday basis. For this reason, we are good enough for a solid Doji candle reversal pattern.
The opening candle should be long-bodied and bearish. The middle candle is the one with the smaller body. A reversal candle is another bullish candle with a long body (usually gaping up). The close of this bullish long-bodied candle should be above the midpoint of the first candle.
Without much selling pressure, the candlestick climbs to higher prices as sellers cover and buyers take advantage of discounted stock pricing.
Morning stars can also appear as morning Doji stars. They look almost identical except for the body of the middle candle. The story of buyers and sellers remains the same.
Bullish Morning Star Example:-
You can see this in action with the BTC example below. A long-body bearish candle, followed by a narrow-body indecision candle. The bulls take control of the next candle and the rest is history.
It is worthwhile to note the volume of the first candle. We cannot assume that this is a complete recession. As you can see, there is buying pressure at lower levels. When a Doji candle is formed, it gives us confidence.
As a result, as soon as the price moves away from the lower level of the green candle; It does this in small amounts.
How can we explain that?
It took less effort to increase the price. Therefore, we can assume that the reverse is "ease of movement". This should give us confidence in our long position.
5. Tweezer Bottom:-
The Tweezer Bottom Bullish candlestick pattern consists of two candles – usually with small bodies. The first should be a red/bearish candle, and the second a green/bullish candle.
Theoretically, the Tweezer Bottom alerts the chart reader to the fact that an attempt is being made to push the price down, but to no avail. Two smaller-sized candles represent the presence of demand in the market.
Supply is being absorbed keeping candles short in the presence of selling pressure, so the volume sign will appear higher.
Entry should be taken as soon as the price breaks through the second candle. Stops can be set on the lows.
Bullish Tweezer Bottom Example:-
BTC is displaying a beautiful tweezer bottom candlestick pattern for us on the 5-minute chart. Note the narrow bodies of the two candlesticks, their symmetry, and the close range from red to green.
The volume of this first red Doji is particularly interesting. Note how high it is here. Given the context, we can interpret this as an absorption of supply.
The second candlestick (green) then rapidly decreases in volume. Thus, our thesis is confirmed that sales are absorbed and eliminated.
6. Piercing Line:-
The piercing line may look similar to a bullish engulfing pattern. The exception is that the piercing line does not completely encircle the previous candle.
It is still considered a bullish candlestick pattern as it overcame the downward momentum to close at least midway in the body of the previous candle.
It pierces the bottom line but inevitably retraces.
Bullish Piercing Line Example:-
Piercing lines may present a greater risk to reward at lower levels of support. They can also act as a spring in the trading range.
This 5-minute chart of BTC shows the combination of an opening range breakout (ORB) with a piercing line. Together, it's a combination that can really add confidence to our entryways.
As with any setup, the more evidence we have to confirm our bias and plan, the better. For this reason, it is always good to ask yourself:
Are the trends in my favor?
Is it time for a change?
Does the volume confirm my thesis?
Is the stock in an area of support or resistance?
Are the multiple timeframes in line with my view?
Trade with care.
If you like our content, please feel free to support our page with a like, comment
Hit the like button if you like it and share your charts in the comments section.
Thank you

btcusdtperpHello everyone, in this analysis I want to show you how to use the smart money analysis method, so stay with me.
This method is a combination of ict and S&D & rtm
The condition for entering the trade is breaking the limits in the higher time frame, such as monthly and weekly, and the second condition is the appearance of a candlestick pattern in the lower time frame.
All ranges are specified and named
If you have any questions, ask under this post so that I can answer to the best of my ability

Stochastic + RSI + MACD zero cross strategy from backtest on SPYStrategy
1. Stochastic cross at 50 level
2. RSI cross at 50 level
3. MACD cross at 0 level
4. Engulfing Candlestick?
5. Level 2 Tape sentiment balance (Optional)
Technical Analysis
It's a simple technical analysis setup strategy for bullish or bearish trading setup in both bullish and bearish sentiment scenarios. All levels in the indicators are at standard default settings.
Step One:
Look at the Stochastic indicator cross at 50 level and a cross over the signal line. This will be the first check and we want the cross to occur at the 50 level.
Step Two:
Check the RSI and need a cross at 50 level. This is the second confirmation.
Step Three:
Check the MACD cross and it's best to wait for the cross to happen at the zero line. This has a lower instances from occurring but it helps to avoid fake-outs that MACD is prone to showing.
Step Four:
Look for an engulfing candlestick pattern in the chart for a final confirmation.
Step Five (Optional):
If you have access to Level II quotes and the Time&Sales, watch for a momentum into the Ask side for a bullish sentiment or the Bid side for a bearish sentiment. Also you'll need to be familiar with tape reading on the volume and speed for better entry or exit.

Learn to Read Candlestick Strength | Trading Basics
Hey traders,
In this educational article, we will discuss how to objectively measure the market momentum with candlesticks.
Please, note that the concepts that will be covered in this article can be applied on any time frame, however, higher is the time frame, more trustworthy are the candles.
Also, remember, that each individual candle is assessed in relation to other candles on the chart.
There are three types of candles depending on its direction:
🟢Bullish candle
Such a candle has a closing price higher than the opening price.
🔴Bearish candle
Such a candle has a closing price lower than the opening price.
🟡Neutral candle
Such a candle has equal or close to equal opening and closing price.
There are three categories of the strength of the candle.
Please, note, the measurement of the strength of the candle is applicable only to bullish/bearish candles.
Neutral candle has no strength by definition. It signifies the absolute equilibrium between buyers and sellers.
1️⃣Strong candle
Strong bullish candle signifies strong buying volumes and dominance of buyers without sellers resistance.
Strong bearish candle means significant selling volumes and high bearish pressure without buyers resistance.
Usually, a strong bullish/bearish candle has a relatively big body and tiny wicks.
2️⃣Medium candle
Medium bullish candle signifies a dominance of buyers with a rising resistance of sellers.
Medium bearish candle means a prevailing strength of sellers with a growing pressure of bulls.
Usually, a medium bullish/bearish candle has its range (based on a wick) 2 times bigger than the body of the candle.
3️⃣Weak candle
Weak bullish candle signifies the exhaustion of buyers and a substantial resistance of sellers.
Weak bearish candle signifies the exhaustion of sellers and a considerable bullish pressure.
Usually, such a candle has a relatively small body and a big wick.
Knowing how to read the strength of the candlestick, one can quite accurately spot the initiate of new waves, market reversals and consolidations. Watch how the price acts, follow the candlesticks and try to spot the change of momentum by yourself.
❤️If you have any questions, please, ask me in the comment section.
Please, support my work with like, thank you!❤️

'RESUME' the trend journey via 'PAUSE' candleWe all have experienced the 'TRAIN' journey and similar to that in the stock market we have the 'TREND' journey.
In the 'TRAIN' journey we have stoppages in between our destination called stations and like in the 'TREND' journey we have stoppages
called levels.
And then, among the levels, the most frustrating one is 'pause' where stock price show opposite candles that is against the trend and where most
traders are hunted.
This post is all about the 'pause' and how to use it to enter the trend and finally reach our destination through the 'TREND' journey.
Definition:- As the name suggests pause candle is the candle formed in between the trend, the change is usually opposite the trend
i.e. if the underlined script is moving in an uptrend then the pause candle will be of negative change and the color will be red and vice-versa.
The pause candle indicates a pause in fresh positions by market participants and an entry chance for players expecting reversals.
Also, it's an opportunity for new players to enter the trend i.e. for those who have missed the initial trend.
Rules or Characteristics of a pause candle:-
1. Prior candles should be aggressive i.e. large candles of the opposite color.
2. It is generally of very small size as compared to the previous one and of the opposite color.
3. Volume is considerably low as compared to previous candles.
4. The RSI level of the spot where this candle originates is usually between the band of 35-75 which confirms that trend has not come to exhaustion.
The psychology behind the pause candle:- In the market everything has a cause and a reason similar pause candle also conveys its message to the market players.
The generation of the pause candle signifies that there is fatigue among the participants who were driving the stock or are taking some break.
Also, it alerts that new hands have entered into the trend and are trying to offer resistance. Those who are looking for reversals spot this candle and enter into
trade with the hope of reversals, they are generally weaker hands.
Bigger hands those who were the driving force of the trend also want the new player to enter the trend so that they hunt them down and resume the
rally at a lower price.
How to trade pause candle:- Now, as small players, we don't know what goes inside but try to predict the message through the candle. If a pause candle
is formed it doesn't mean the exhaustion of trend or reversal rather indicates a pause in fresh market position.
But, here the aggressive trader enters with trades opposite to the trend. At this stage, two cases arise, note talking for an uptrend:-
-> The next candle's high crosses above the high of the pause candle:
Maximum times this is the case that arises, here the candle after the pause candle crosses the high of the pause candle now what does this indicate?
The indication is that the trend drivers or bigger hands are active again and those who have taken a position against the trend are trapped and will
try to escape hence, the move will be much sharper as compared to the initial trend.
How to benefit in this case? When you spot such a pause candle that is formed after a continuous trend set it to alert candle and wait for the next candle
to form. If the next candle crosses the high of the pause candle take the position along the trend and your stop would be the low of the pause candle which is generally
too small and ride the sharper trend which is usually equal to the initial one.
-> The next candle's low crosses below the low of the pause candle:
Though not arises usually sometimes it does occur, here the candle after the pause candle crosses the high of the pause candle now what does this
indicate?
The indication is that the trend drivers or bigger hands are in the backseat and are not seeing further upside also there is a chance that they can book
profits at this level.
How to benefit in this case? When you spot such a pause candle that is formed after a continuous trend set it to alert candle and wait for the next candle
to form. If the next candle crosses below the low of the pause candle take the position against the trend and your stop would be the high of the pause candle which is generally
too small and ride the reversal trend which is usually half of the initial one. This case comes under the reversal candlestick patterns on which earlier an article was published
by me but here we are concerned about a pause candle after which rally resumes.
Note: The only constraint is to identify the correct pause candle for which you can refer to the above-said rules. Sometimes the candle after the pause candle
crosses both the high and low of the pause candle in that circumstance you have to check the color of the candle, for uptrend it should be green then you can
take the position else if it's red then wait for the next candle, and vice-versa for the downtrend.

Engulfing candlestick:Education!!!What is a pattern of engulfing candlesticks?
On a price chart, engulfing candlestick patterns consist of two bars.They are used to signal a market turn around.The second candlestick will be much larger than the first, covering or "engulfing" the entire length of the bar before it.

Shooting Star Candlestick
What is the Shooting Star Pattern?
1. A shooting star is a type of candlestick pattern which forms when the price of the security opens, rises significantly, but then closes near the open price.
2. The distance between the highest price of the day and the opening price should be more than twice as large as the shooting star’s body.
What does Shooting Star tells you?
1. Shooting stars signals a potential downside reversal and is most effective when it forms after 2-3 consecutive rising candles having higher highs.
2. A shooting star opens and rises strongly during the trading session, showing the same buying pressure that is seen over the last trading sessions.
3. At the end of the trading session, the sellers push the price down near the open.
4. This shows that the buyers have lost control by the end of the day, and the sellers have taken over.
5. The long upper shadow indicates that the buyers are losing position as the price drops back to the open.
6. The candle after the shooting star gaps down and then moves lower on heavy volume.
7. This candle helps in confirming the price reversal and indicates that the price will continue to fall.
Trading Scenario
1. Trade Entry: Before you enter a shooting star trade, you should confirm that the prior trend is an active bullish trend.
2. Stop Loss: You should always try to use a stop-loss order when trading the shooting star candle pattern.
3. Taking Profits: The price target for this trade should be equal to the size of the shooting star pattern.
Limitations of Shooting Star
1. One should not only rely on a candle pattern like in a shooting star for making trading decisions.
2. This is why confirmation is required, one can confirm by the next candle or other technical analysis indicators.
3. One should also use stop losses when using candlesticks to control the losses.
4. A candlestick pattern is more significant when it occurs near an important level signaled by other forms of technical analysis.

2 Steps in Drawing a Downtrend Channel A buying strategy in a downtrend.
How to identify buying opportunity in a downtrend?
Not my preference to buy in a downtrend, but that does not mean we should avoid it when buying opportunity arises.
Recognizing it is a downtrend, we keep our buy position short-term; as we are going against the trend.
Discussion: Rules in constructing a downtrend parallel trendline
Rule 1 – First the downtrend line
Rule 2 – Then, its parallel
Disclaimer:
• What presented here is not a recommendation, please consult your licensed broker.
• Our mission is to create lateral thinking skills for every investor and trader, knowing when to take a calculated risk with market uncertainty and a bolder risk when opportunity arises.

Horn Tops & Bottoms Pattern - How To Find and Trade ThemHorn patterns are reversal patterns introduced by Bulkowski in his book "Encyclopedia of Chart Patterns". These reversal patterns are not the most commonly used by traders but have very interesting characteristics.
In this post, we will cover details about these interesting patterns, such as identification rules and measure rules.
1. Origin
Bulkowski discovered horn patterns by studying double tops/bottoms patterns. In his study, he noticed that narrower double bottoms performed better than widely spaced ones, and as such wondered how would perform double bottoms spaced by a single week on a weekly chart.
The usage of the weekly timeframe is based on ease of selection and performance considerations, but horn patterns are also visible on the daily timeframe.
2. Identification
Horn patterns are relatively easy to identify. The identification of both horns' tops/bottoms should be done on the weekly timeframe.
2.1 Horn Tops
The horn tops pattern is characterized by two price highs situated at a similar level, both separated by a candle whose price high is lower than the two adjacent. These can occur in an uptrend but also on the top of downtrend retracements.
In an uptrend, this pattern should be clearly visible with prior highest highs inferior to the pattern high.
2.2 Horn Bottoms
The horn bottoms, also referred to as "inverted horns" pattern is characterized by two price lows situated at a similar level, both separated by a candle whose price low is higher than the two adjacent. These can occur in a downtrend but also on the bottom of uptrend retracements.
In a downtrend this pattern should be clearly visible with prior lowest lows superior to the pattern low.
3. Trading
Because of the usage of the weekly timeframe, we can see that trading horn patterns can be more suited to longer term investors.
Two approaches can be used when trading horn patterns, trading on identification, that is when the pattern is clearly identified, or trading on confirmation, the latter is the one covered by Bulkowski.
A horn top pattern is confirmed when the price breaks below the minimum of the pattern formation, while a horn bottom pattern is confirmed when the price breaks above the maximum of the pattern formation.
3.1 Measure Rule
The measure rule for horn patterns allows traders to set stop losses and take profit according to the pattern.
For horn bottoms patterns the target price is found by adding the formation height (maximum - minimum) to the formation maximum.
For horn top patterns the target price is found by subtracting the formation height (maximum - minimum) to the formation minimum.

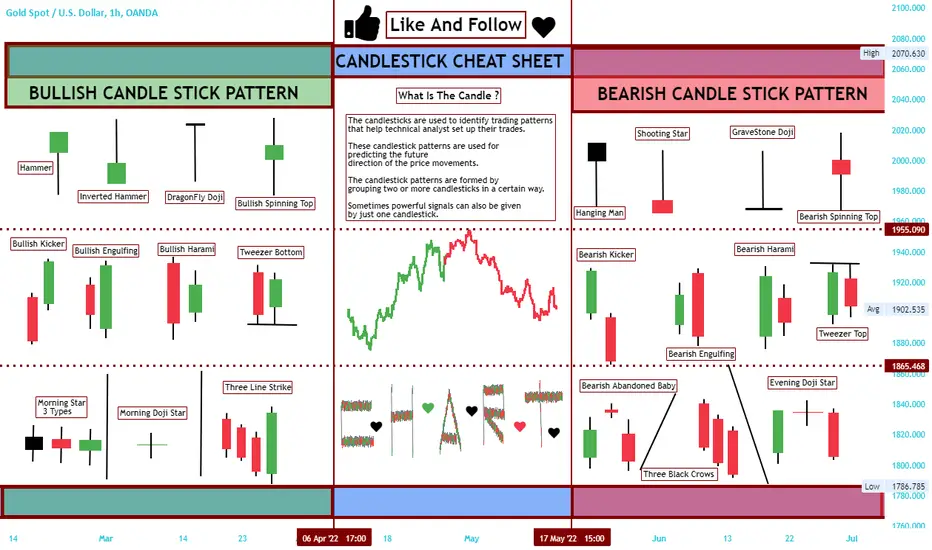
Candlestick Cheat Sheet You Must To Know➡️ Hi Trader's Whats Up Today ? Am Feel Good With New Education Post Will Inform You Many Details About Candles And Price Action ..
Let,s Start With " Bullish Candle Stick Patterns " ✅⬆️✅
1- Hammer
2- Inverted Hammer
3- Dragon Fly Doji
4- Bullish Spinning Top
5- Bullish Kicker
6- Bullish Engulfing
7- Bullish Harami
8- Tweezer Bottom
9- Morning Star
10 - Morning Doji Star
11 - Three Line Strike
Next Wave Will Be With " Bearish Candle Stick Patterns " ✅⬇️✅
1- Hanging Man
2- Shooting Star
3- Grave Stone Doji
4- Bearish Spinning Top
5- Bearish Kicker
6- Bearish Engulfing
7- Bearish Harami
8- Tweezer Top
9- Bearish Abandoned Baby
10 - Three Black Crows
11- Evening Doji Star
That' All My Friends And Show You In New Post ❤️
Top candlestick Patternshello everyone.
we have the more important candlestick patterns here.
these patterns are powerful when occur in 2 situation together:
1)on top or bottom of a trend
2)when we are at an important support or resistance level.
combination of these patterns with other technical patterns and tools
can be very useful and powerful also.
hope have good trades.

Most Popular Types Of Candles How to Read Candlestick charts?
Candlestick charts were originated in Japan over 100 years before the West had developed the bar charts and point-and-figure charts. In the 1700s, a Japanese man known as Homma discovered that as there was a link between price and the supply and demand of rice, the markets also were strongly influenced by the emotions of traders.
A daily candlestick charts shows the security’s open, high, low, and close price for the day. The candlestick’s wide or rectangle part is called the “real body” which shows the link between opening and closing prices.
This real body shows the price range between the open and close of that day’s trading.
When the real body is filled, black or red then it means that the close is lower than the open and is known as the bearish candle. It shows that the prices opened, the bears pushed the prices down and closed lower than the opening price.
If the real body is empty, white or green then it means that the close was higher than the open known as the bullish candle. It shows that the prices opened, the bulls pushed the prices up and closed higher than the opening price.
The thin vertical lines above and below the real body is knowns as the wicks or shadows which represents the high and low prices of the trading session.
---------------------------------------
1- Hammer Candle
Hammer is a single candlestick pattern that is formed at the end of a downtrend and signals a bullish reversal.
The real body of this candle is small and is located at the top with a lower shadow which should be more than twice the real body. This candlestick chart pattern has no or little upper shadow.
The psychology behind this candle formation is that the prices opened, and sellers pushed down the prices.
Suddenly the buyers came into the market and pushed the prices up and closed the trading session more than the opening price.
This resulted in the formation of bullish pattern and signifies that buyers are back in the market and downtrend may end.
Traders can enter a long position if next day a bullish candle is formed and can place a stop-loss at the low of Hammer.
-----------------------------------------
2- Hanging Man
Hanging Man is a single candlestick pattern which is formed at the end of an uptrend and signals bearish reversal.
The real body of this candle is small and is located at the top with a lower shadow which should be more than the twice of the real body. This candlestick pattern has no or little upper shadow.
The psychology behind this candle formation is that the prices opened and seller pushed down the prices.
Suddenly the buyers came into the market and pushed the prices up but were unsuccessful in doing so as the prices closed below the opening price.
This resulted in the formation of bearish pattern and signifies that seller are back in the market and uptrend may end.
Traders can enter a short position if next day a bearish candle is formed and can place a stop-loss at the high of Hanging Man.
-----------------------------------------
3- Three White Soldiers
The Three White Soldiers is a multiple candlestick pattern that is formed after a downtrend indicating a bullish reversal.
These candlestick charts are made of three long bullish bodies which do not have long shadows and are open within the real body of the previous candle in the pattern.
-----------------------------------------
4- Inverted Hammer
An Inverted Hammer is formed at the end of the downtrend and gives a bullish reversal signal.
In this candlestick, the real body is located at the end and there is a long upper shadow. It is the inverse of the Hammer Candlestick pattern.
This pattern is formed when the opening and closing prices are near to each other and the upper shadow should be more than twice the real body.
----------------------------------------
5- Piercing Pattern
Piercing pattern is a multiple candlestick chart pattern formed after a downtrend indicating a bullish reversal.
Two candles form it, the first candle being a bearish candle which indicates the continuation of the downtrend.
The second candle is a bullish candle which opens the gap down but closes more than 50% of the real body of the previous candle, which shows that the bulls are back in the market and a bullish reversal is going to take place.
Traders can enter a long position if the next day a bullish candle is formed and can place a stop-loss at the low of the second candle.
----------------------------------------
6- White Marubozu
The White Marubozu is a single candlestick pattern that is formed after a downtrend indicating a bullish reversal.
This candlestick has a long bullish body with no upper or lower shadows which shows that the bulls are exerting buying pressure and the markets may turn bullish.
At the formation of this candle, the sellers should be caution and close their shorting position.
Don't Forget To Like And Follow To Next Part

A simple strategy for low timeframesHello, good morning, I want to introduce a simple strategy to those who trade in low frame time.
For example, I'm on the Dow Jones chart for 5 minutes at a time frame
Take a closer look at this backtest
You must first find support and resistance levels
In the next neighbourhood, be patient until the price hits that level
Now wait for the first candle to form relatively independently of that surface
By independent candlestick, I mean to see a candlestick that starts to form without contact with the surface and closes in such a way that it does not come into contact with that surface again.
A candle that has no contact with the desired surface either at the beginning or at the endpoint.
We can now expect the price to move with the size of the independent candlestick length.
simply
To better understand, watch the image or ask a question after watching it.
I should mention that i always consider one unit of profit and one and a half units of loss

Dark Pool Buy Zones™Some traders try to watch Level 2 data to discern when the large-lot orders come through to get an idea of when the big institutions are accumulating in the Dark Pools, but you really don’t need that. Plus, whether that’s accurate is questionable since Dark Pool transactions are reported way after they were transacted.
“Dark Pool buy zones” is a term I coined because Dark Pools use precise controlled orders that trigger automatically over extended periods of time. Since the Buy Side Institutions using the Dark Pools are primarily buying for the long term, price can sometimes drop down before moving up, creating a range in the price action, what I call “the buy zone.”
When you learn to recognize the Dark Pool Candlestick and Indicator Patterns, you can be ready for the bottom to develop and look for Dark Pool accumulation patterns to plan your trading.
Below is an example. Ford is still falling, but the Dark Pool buy zone support is close. I’ll be waiting to see how the bottom develops around that level before making my decision to trade.
Happy TechniTrading!
Please like and follow if you found this interesting.
