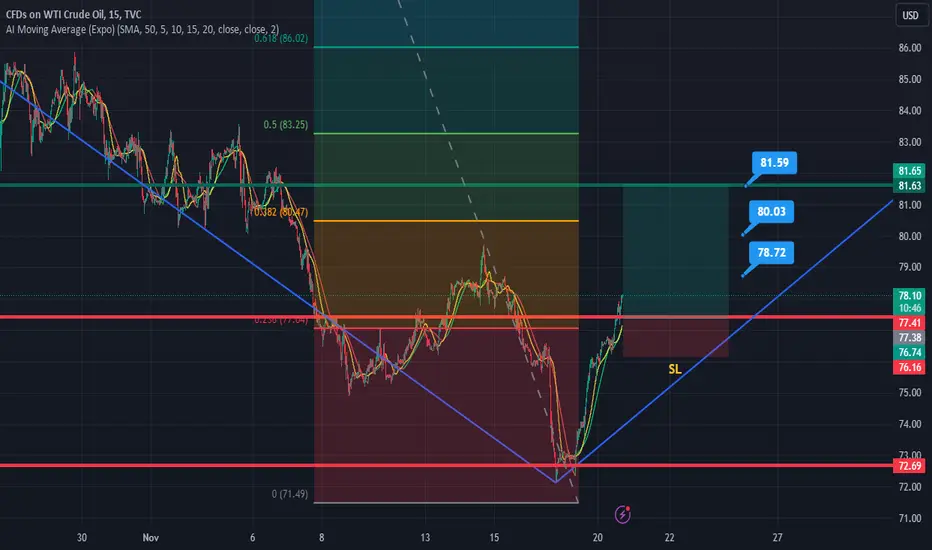
✅CRUDE OIL STRONG RESISTANCE AHEAD|SHORT🔥
✅CRUDE OIL is going up now
But a strong resistance level is ahead around 79.30$
Thus I am expecting a pullback
And a move down towards the target of 76.00$
SHORT🔥
✅Like and subscribe to never miss a new idea!✅
Crude-oil

BUY USOIL !!! TIME TO RETRACE hello traders as i can see its a great entry point for oil to caught some easy pips oil had created a good support zone on last daily low in shorter TF its seems more upside to test broken support zone Saudi and Russian are stick on their cut policy and war is also creating more demands
trade with ur on risk its just and trade idea if ur like our prediction we appreciate ur support it help our trader community stay tuned for more updates
Crude Oil Found The Support?Crude oil is trading lower, currently showing blue wave C in late stages of a corrective wave B pattern. We can also see now five subwaves down within C from 88/89 zone, where final subwave (5) of C can be now coming to an end with a huge volume increase. We can actually already see a sharp bounce from the support that can be signal for a minimum three-wave recovery back to 80 area. If we get a five-wave impulsive recovery back above channel resistance line and 80.00 level, that's when we may call a bottom for crude.

Crude Oil - New Lows - DailyCrude Oil just printing another LOWER-LOW.
78 support line became now a resitance zone , so we can see 73-74 zone , very soon.
Also OPEC anounced that they estimate an increase in barels per day in 2024-2025 , that is a bearish info beacause they already cut the production every month and the price is still in down trend, so with an slower economy also the demand its lower for OIL...so medium term im bearish on it.

WTI POSSIBLE RALLYOil prices rebounded after experiencing losses last week, primarily due to expectations of a tight supply situation for the rest of the year. This rebound was driven by key factors, including the commitment of major oil producers Saudi Arabia and Russia to maintaining production cuts until the end of the year. The decrease in the U.S. oil rig count also played a role, as it indicated a lack of response from U.S. producers to the current price environment, giving confidence to Saudi Arabia to continue withholding supply from the market. Additionally, concerns about potential supply disruptions in the Middle East related to the Israel-Hamas conflict subsided, contributing to the market's rebound.
The oil market is now closely focused on economic data from China, particularly trade and inflation figures, to gauge commodity demand in the country. While China's oil imports and fuel demand have remained robust, rising stockpiles could lead to a drop in oil imports in the coming months, especially if economic conditions deteriorate. Meanwhile, the overall health of the U.S. economy, another major consumer of oil, remains a factor influencing oil demand, with expectations of weakening demand during the winter season. Additionally, a weaker U.S. dollar is currently providing some support to oil prices, but it may also reflect concerns about a cooling U.S. economy, which could impact oil consumption.
If the trend continues the price might reach levels of 90.51, in the opposite scenario the price might drop to 80.49.
Risk Disclosure: Trading Foreign Exchange (Forex) and Contracts of Difference (CFD's) carries a high level of risk. By registering and signing up, any client affirms their understanding of their own personal accountability for all transactions performed within their account and recognizes the risks associated with trading on such markets and on such sites. Furthermore, one understands that the company carries zero influence over transactions, markets, and trading signals, therefore, cannot be held liable nor guarantee any profits or losses.

A Traders' Weekly Playbook - energy markets to direct sentimentWe look at the scheduled economic data and US earnings this week and question if given the fluid news flow from the Middle East, these events move the dial or if geopolitics consumes the full attention and direct sentiment.
We saw a rush to hedge portfolios on Friday ahead of a darkening picture emerging in the Middle East. The situation is dynamic and it's too early to say if the hedges placed on Friday are unwarranted, but there have been pockets of positive news flow – for example, US Secretary of State Blinken saying aid will get to Gaza via the Egyptian border, and Israel opening water supply to Southern Gaza, with over 600k Gazans moving south.
A call between US National Security Advisor Jake Sullivan and Iranian officials is a development, with the US warning not to increase aggression. As Israel's ground offensive pushes into Gaza, risk and energy markets will look for headlines and actions from Iranian officials who have stated they have a duty to come to the aid of the Palestinians.
Watching crude and Nat Gas
The energy markets are the first derivative to drive broad market sentiment this week, with crude and Nat Gas leading investors to trade volatility (options), as well as classic hedges such as gold and Treasuries. Amid a backdrop of ‘higher for longer’, and the US CPI inflation gaining 0.4% in September, higher energy prices could deliver a one-way punch to sentiment.
Given market participants are generally poor at pricing risk around geopolitical developments, it's no wonder most have looked to mitigate drawdown - but at this stage, while there is a growing wall of worry to potentially climb, the probability is traders will use strength in risky assets to reduce exposures.
The probability of supply disruptions is one of the key aspects here – last week we saw the closure of Chevron’s Tamar gas field in Israel – the focus has been rerouting that gas from the Leviathan gas fields in the North of Israel – if the market feels this gas field could be impacted then could see a spike in EU NG. Many energy experts see the risk of a supply event here as fairly low, but should developments escalate on various fronts, then the market will increase the possibility of a disruption.
The bear case for risk, given the potential for a significant rally in EU NG and crude, would be where the market increases the probability of Iran curtailing the movement of LNG through the Straits of Hormuz, where notably Qatar LNG supply (20% of the global LNG market) would be impacted. Again, this seems a low probability at this stage, but that will depend on Iran’s ongoing involvement and any new sanctions placed on them.
Downside risk to the EUR
If EU NG spikes higher in the near term, then talk of a renewed energy crisis in Europe will resurface and the EURUSD could be headed to parity. As said, this probability is a lower risk right now, but when considering the risks, this is the market concern that will be monitored.
While sentiment will move around on each headline, we revisit the hedging flows seen on Friday, as traders de-risked ahead of potential gapping risk – It’s too hard to make a call on whether these hedges are partly unwound in Asia.
Where did we see the hedging flows?
• Gold rallied 3.4% on Friday - a 3-sigma move and the second biggest day since 2020. A massive 299k gold futures contracts traded, the highest since May. XAUUSD 1-month implied volatility has pushed to 15% and 1-week call volatility has increased to a 1.75 vol premium to puts – the most since March.
• The XAUUSD price closed at a 2.8% premium to the 5-day moving average, which shows the sheer pace of the intraday rally, with limited intraday mean reversion – sellers just stood aside.
• Brent crude closed 5% higher with our Brent price closing over $91 and eyeing a move back to the recent highs of $96 – WTI Crude futures saw the curve lift and go further into backwardation – this typically means the market sees a higher probability of a supply shock.
• In equities, the VIX traded to a high of 20.78%, settling at 19.3% (+2.6 vols on the day) – a VIX index at 19.3% implies daily % changes in the S&P500 of 1.2% and 2.7% on the week.
• S&P 1-month put implied vol now trades at a 5.46 vol premium to 1-month calls – This volatility ‘Skew’ is now the most bearish since May – traders are ramping up the demand for downside puts to protect in case of drawdown.
• Market breadth was ok with 46% of S&P500 stocks closed higher – there was no blanket selling, but a rotation from tech and consumer names into energy and defensive sectors - staples, utilities, and healthcare.
• While we saw some buying in petrocurrencies (NOK & CAD) but traders played defense buying into the CHF & JPY – short NZDCHF was the play of the day (-1.4%), with GBPCHF breaking the long-run range lows.
• US Treasuries rallied with 10’s closing -8bp and 30’s -10bp.
Marquee event risks for the week ahead:
• NZ Q3 CPI (17 Oct 08:45 AEDT) – the market consensus is for 1.9% QoQ / 5.9% YoY (from 6%) – NZDCHF was the biggest percentage mover on Friday following the risk aversion flows – will the sellers follow through?
• UK jobless claims/wage data (17 Oct 17:00 AEDT) – the consensus for wages sits at 7.8% (unchanged) – UK swaps place a 29% chance of a hike from the BoE at the 2 Nov BoE meeting, will the wage data influence that pricing? GBPCHF trades the weakest levels since Oct 2022 and looks likely to be sold on rallies
• US retail sales (17 Oct 23:30 AEDT) – the advanced read is expected at 0.3% mom and the ‘control group’ element at -0.1%. The retail numbers could influence market sentiment, especially if we see a big miss to expectations, with USDJPY and USDCHF the pairs most sensitive to a weaker outcome. Gold could find further buyers on a downside surprise.
• Canada CPI (23:30 AEDT) – headline CPI is expected at 4% yoy, with core CPI eyed at 4% yoy
• Fed chair Jay Powell speaks at the Economic Club of NY (20 Oct 03:00 AEDT) – the highlight of the week. Expect Powell to focus on the view that moves in the bond market are mitigating the need for the Fed to hike further.
• China Q3 GDP (18 Oct 13:00 AEDT) – consensus is 4.5% yoy (from 6.3%) – likely a trough in China’s GDP, with better levels ahead.
• China Industrial production, fixed asset investment, retail sales (18 Oct 13:00 AEDT)
• UK Sept CPI (18 Oct 17:00 AEDT) – the consensus for headline CPI is 6.6% yoy (from 6.7%) / core CPI at 6% yoy (6.2%) – a risk to manage for traders holding GBP exposures
• EU CPI (18 Oct 20:00 AEDT) – no change expected in the revision, with headline CPI eyed at 4.3% /core CPI at 4.5%. Should be a non-event for the EUR and EU equities.
• Australia employment report (19 Oct 11:30 AEDT) – the consensus estimate is for 20k jobs to have been created in September and the U/E rate unchanged at 3.7% - expect the impact from Aussie jobs to be short-lived – preference to work sell limits in AUDUSD on the day and sell into strength.
• China new homes prices (19 Oct 12:30 AEDT)
• China 1 & 5-year Prime Rate (20 Oct 12:15 AEDT) – the consensus is no change with the 1yr rate to stay at 5.2% & the 5yr rate at 3.45%
US Earnings (with the implied move on earnings) – Goldman Sachs (3.7%), Bank of America (4.6%), Tesla (5.2%), Netflix (7.5%)
Central bank speeches:
BoE – Huw Pill, Sam Woods, Swati Dhingra
ECB – Villeroy, Knot, Centeno, Guindos, Holzmann
Fed – see schedule below

Crude Oil Super Bullish Targeting 121 and 149 US $Crude Oil Super Bullish Targeting 121 and 149 US $
I n my previouse Oil Trading Idea I mentioned the main factors why we have reahed the bottom.
I opened the first trades on May the 23rd(See signals above) but gave my stops more rooms, below the 15 Months Support, and as they ´ve been confirme I added more aditional Positions on June 23rd, Last week I added agressively the 3d tranche of my Positions as the market broke 3 very important resistances in raw without any significant pullbacks.
To take these trades needs high levels of patience, weekly news should and can be ignored.
On the same time I closed all my short positions which I continiousely opened from 119 downwards.
My Trading indicators confirmed these levely very nicely, and that is the powerfull answer to all news and news makers, and day traders who lost 90% of their capitals, an following news blindly, or vasting their times and assets in day traing: TREND ALWAYS WINS! ALWAY! NEVER DOUBT ABOUT IT!
Bullish sentiment is building in oil markets as U.S. inventory levels continue to drop while OPEC+ production and export cuts are expected to be extended.
Continuous US stock draws equivalent to a 1 million b/d decline over the past five weeks have led to an unusually tight oil market in the United States, adding upward pressure to oil prices despite economic woes. Widespread expectations of OPEC+ extending production and export cuts as well as recovering Chinese manufacturing activity have added to the bullish sentiment, with ICE Brent surpassing $87 per barrel.
Chevron Workers Reject Company Offer, Start Striking Next Week. Workers at Chevron’s (NYSE:CVX) Australian Gorgon and Wheatstone LNG plants have rejected the company’s pay and conditions offer, moving full steam ahead with planned work stoppages starting from September 7.
Russia Flags OPEC+ Coordination on Track. Russia’s deputy prime minister Alexander Novak announced that OPEC+ members have agreed on the main parameters of production over the upcoming months but would only announce it next week, indicating Riyadh’s and Moscow’s cuts are to continue.
International Banks Team Up in Glencore Battle. Glencore’s (LON:GLEN) stock performance has been anemic recently as a whopping 197 claimants took the trading giant to London courts over “numerous misleading statements” and repeated cases on unlawful conduct, with several African bribery cases.
Oil Majors Lament on US Wind Power Prices. European oil majors Equinor (NYSE:EQNR) and BP (NYSE:BP) are seeking a 54% increase in the purchase agreement prices of three planned US wind farms, according to a NY regulatory filing, with the initial strike prices set at $108-118 per MWh.
Argentina Ramps Up Shale Gas Offtake. The home of Argentina’s shale gas play Vaca Muerta, the province of Neuquen, posted record high gas injection levels this month, topping 100 Mcf per day, as a new gas pipeline connecting the fields to the capital Buenos Aires was inaugurated recently.
Higher Interest Rates Prompt LNG Plants to Hike Fees. A string of US LNG developers, most notably NextDecade (NASDAQ:NEXT) with its Rio Grande LNG project, adjusted term deals signed earlier and increased liquefaction fees to reflect rising interest rates and higher construction costs.
Gabon Coups Leaves Regional Trade on Tenterhooks. At least 30 commercial vessels, of which at least 6 tankers, anchored in Gabon’s territorial waters after the military seized power in the African country from long-time president Ali Bongo, with Libreville halting port operations.
Trans Mountain Pipeline Faces New Delays. Trans Mountain Corp, the operator of the eponymous pipeline, expressed its fears that its Q1 2024 commissioning might be delayed as the Canadian government is still yet to approve a route deviation on a 0.8-mile section, opposed by a First Nation.
First Gulf Coast Wind Auction Triggers Weak Interest. The first-ever offshore wind auction in the US Gulf Coast ended with a single $5.6 million bid for 102,480 acres off Louisiana coming from German renewable developer RWE (ETR:RWE), the lowest winning bid for a federal wind lease.
Chevron Evacuates Its Gulf Coast Platforms. US oil major Chevron (NYSE:CVX) evacuated its staff from three oil platforms in the Gulf of Mexico – Blind Faith, Petronius and the soon-to-be-decommissioned Genesis – ahead of Hurricane Idalia, shutting in some 125,000 b/d of production capacity.
Gazprom Hides Production Figures as Sales Drop. Russia’s leading gas producer Gazprom (MX:GAZP) stopped reporting export figures as it published financial results for the first half of 2023, posting $3.1 billion in net profit, a mere quarter of its $12 billion EBITDA for the same period.
Japan Extends Oil Subsidies Until End-2023. Japan’s Trade and Industry Ministry (METI) extended oil product subsidies until the end of December 2023 as retail gasoline prices soared to the highest readings ever this week, reaching $200 per barrel, boosted by higher oil prices and a weaker yen.
Lithium Prices Go into a Tailspin. Having already halved since January, Chinese lithium prices have dropped a further 10% in August as lithium hydroxide EXW China quotes fell to $33,500 per metric tonne, below those of lithium carbonate, amid poor demand for high-nickel cathodes.

Crude oil I've been watching oil closely for the last two months. I would like to say that oil is a trending instrument, we started the decline from 95$ per barrel and fell quite rapidly until the conflict in the Middle East. all news resources said that oil rose in price on the background of this news. Technically, I was waiting for this upward correction. But if the war will really be global, the price of oil should be cheap to strengthen the US and the dollar, and these goals began to be fulfilled. In what way?
I have written about this many times, that what we trade is futures oil, in the financial market, and the main players in futures oil are City Bank, Goldman Sachs, JPMorgan Chase
read more
Best regards EXCAVO

Canadian Dollar strength driven by Oil pricesAs crude oil prices climb due to the geopolitical conflict, has resulted in the Canadian Dollar gaining strength.
With the prices testing the 1.36 price level, the idea was a bounce above the 23.60% fib retracement level could see a continuation to the upside.
However, with the DXY weakening, look for the USDCAD to break below the longer term fib retracement level of 61.8% to signal a continuation of the recent downtrend, with the next major support level at 1.34

Crude trader - trying to price certainty in conflict The high on our Brent crude price has been $89.68 – hit at midday – but while our clients are long of crude (65% of open interest is held long), we’re seeing better sellers in the broader market, as we roll towards EU trade. The early rally felt reasonably orderly, but a lot of questions were being asked and without many immediate answers to obtain the certainty we crave as market participants - so naturally in this backdrop we get outsized moves, as a lack of clarity causes dispersions in price. When it comes to knowledge most market participants are now military experts and have quite poor knowledge of Middle East relations – again this makes it harder to price risk.
Our US crude price sits up 3.8%, off the earlier highs of $87.45 and holds the 50-day MA – should EU/UK traders come in and buy the slight intraday dips then $89.03 is the level to watch topside for supply. It could go either way, but on balance I favour selling into intraday rallies.
Today been some reversal after the recent drawdown in crude into $82 – positioning played a big part in that run, but we had seen signs that the Saudis may look at increasing production at year-end. We had even seen positive steps at a geopolitical level; brokered by the US, an agreement that Saudi would recognize Israel and as MBS said, forge “the biggest historical deal since the end of the Cold War”. Instead of this positive backdrop, we have seen a 180-degree turn with Hamas's attack on Israel, with the market now questioning if we could see engagement with Hezbollah and Lebanon. With President Biden standing firm with Israel, the view is Iran’s oil exports which have been growing will be cut.
If we look at Crude ‘time spreads’ – that is, front-month crude futures – June 2024 futures - we see this +$0.97, so modestly higher – if we really felt like Saudi production was going to get impacted by the unfolding situation then this would higher still.
If in doubt, switch gears and head to Nat Gas which is building on the recent breakout and looks like it may start to bull trend.

Equalized Natural Gas and Crude Oil Over DecadesThe goal of this chart is to attempt to show the impact of energy costs in the current economy. We use equal amounts of natural gas and crude oil according to economic websites, so a chart that shows the year-over-year % change of energy costs would be useful to look at so we aren't confused by headlines.
Everyone seems to be looking at crude oil as the main driver of inflation, but at the same time refusing to see that natural gas has fallen quite dramatically over the same time window.
What I have done with this chart is to plot the ratio of the price of crude oil to natural gas using the 2nd month contract because of the negative price of crude oil in 2020. The current ratio is around 26, so I then used the 26 ratio to plot the top chart. I multiplied NatGas by 26 and added it to Crude Oil to get a "total energy cost" to the economy. I then did a 1 year rate of change to show the oscillations of "bearish headwinds" of inflation and "bullish headwinds" of deflation. Obviously, lower energy prices are supportive of the economy and higher energy prices are inflationary and imply producers and sellers will raise prices, putting pressure on the Fed to raise rates to cool off the economy.
Currently, we have a -31.59% YOY% change for the total cost of energy and as recently as May we were at -61%.
Granted, energy is not the entire economy. Energy is only 6% of the economy so it is just a small part but it feeds into everyone's costs.
Next I will work on some ways to create specific market buy and sell signals to see if we can make a permanent indicator for this idea.
Wishing you all well.
Tim West
9:06AM EST, Wednesday October 4, 2023

CRUDE OIL Risky Long! Buy!
Hello,Traders!
CRUDE OIL fell down
Sharply but will soon hit
A horizontal support
From where I will be expecting
A bullish rebound
Buy!
Like, comment and subscribe to help us grow!
Check out other forecasts below too!

✅CRUDE OIL LOCAL CORRECTION AHEAD|SHORT🔥
✅CRUDE OIL is trading in an
Uptrend and oil tried to break
A strong horizontal resistance
Level of 93.64$ but failed so
It seems that the bulls are not
Strong enough yet which
Combined with the fact that
Oil is clearly overbought makes
Me expect a local correction
SHORT🔥
✅Like and subscribe to never miss a new idea!✅

CRUDE OIL Long From The Rising Support! Buy!
Hello,Traders!
CRUDE OIL is trading in
An uptrend along the rising
Support and Oil is now about
To retest is so I think that
We will see a local move up
Buy!
Like, comment and subscribe to help us grow!
Check out other forecasts below too!

CRUDE OIL HEADING TO $100. DONT SELLA growing number of analysts forecast Brent will surpass $100 a barrel this year as demand rises, supply is constrained, and stocks of fuel and crude are relatively low. Retail fuel prices in the U.S. and Europe have risen to multi-month highs as crude prices have rallied.
Good morning, Peter Vanham here in Geneva, filling in for Alan.
Looking a year out, economists don’t just expect “higher for longer” interest rates; that phrase also applies to oil prices, which are predicted to edge up to around $100 per barrel into next summer.
The Biden administration is keen to keep pump prices in check ahead of the presidential election next year, where inflation and fuel costs have already become areas of attack for the Republican party.
After dropping below $70 a barrel (bbl) in early summer, the price of West Texas Intermediate (WTI) crude has been steadily marching higher. Last week, the price breached $90/bbl for the first time in a year, and there are no signs that the rise is slowing.
Further increases would negatively impact consumers, especially for gasoline and transportation costs. While the Federal Reserve’s rate hikes have helped curb inflation, factors like oil supply dynamics are outside their control. Rising oil prices put the Fed’s attempts to engineer a soft landing for the economy in jeopardy.
If Russia and Saudi Arabia want oil prices to rise above $100/bbl — which will hurt President Biden as he heads into an election year — they have the power to make that happen. Given their likely preference for a return of Donald Trump to the White House, I expect them to exercise that power.

CORN vs CRUDE Here's a quick view of CORN vs CRUDE which has been moving together for the past ten years with some variation.
With CRUDE pushing highs here (Price Inflation fears rampant) and CORN pushing new lows (Food Deflation - no fears about falling corn prices in the news warning about falling inflation), it seems obvious to put up a chart showing how these two markets are set up at the moment.
CORN and CRUDE have moved to an extreme and with CORN pointing lower I am seeing that there is a trade setting up.
In the past, I was constructive on CORN and was looking for corn to catch UP to crude oil, but that didn't materialize like it did in the 1970's with a 4-fold advance. The monetary inflation we have had in both cycles would have supported much higher corn prices.
However, here we are. Corn has fallen to lows going back more than a year, but the obvious story is that crude oil is making 52-week highs. Side note: You can also see that crude oil is down 7% from 2012 or 11 years ago. This is NOMINALLY as well. Inflation has been substantial for the last 11 years and may be 40% or 50%.
Also note that corn is down 45% from 11 years ago "NOMINALLY". After inflation, corn prices are down 60% or more.
So, this trade sets up within the near future and you could put both sides on: long corn, short crude. Or you can take sell signals only on all technical setups for crude on the daily chart. I would suggest do a little of both and have 5 different definitions of "technical trend" to follow. The simplest is "sell a 5-day new low" and use a stop over the 5-day high.
Stay tuned!
Tim West
September 20, 2023 11:48AM EST

Crude Oil versus Stock PricesDrops in crude oil have an impact on stocks in a positive way.
The important point to remember is that falling crude oil prices have a lagged effect on the overall equity market. How long is that lag? It changes over time but it is approximately 6 months.
When oil prices rise, it too has a lagged effect on the market by a variable amount of time. Of course, it depends on many factors, regulatory and global risks constantly change. I am not covering the risk of rising oil price with this chart, only reinforcing the positive impacts of falling oil prices.
Oil prices are the most-watched price since we see them on gas station signs everywhere we drive and yet it doesn't have instant impact on the economy.
Look at the history of the price of crude oil and the price of stocks. They are related as you can see when I plot the large drops in crude and the price level of stocks when that drop occurred.
Tim 9/18/2023 10:19AM EST

Double CPI Day for the EUR & CADCertain weeks stand out in importance, and the week ahead is shaping up to be one of them.
On the economic calendar we have the Eurozone & Canada CPI as standouts for Tuesday, UK CPI & FOMC on Wednesday. Such action-packed weeks often provide the catalyst for the next move in the markets.
Our attention is currently drawn to the EURCAD for multiple reasons. Firstly, from a technical perspective, we see the EURCAD completing a head and shoulder pattern on a daily timeframe, which is generally associated with a trend reversal. This is further supported by the 200-day simple moving average, which has consistently marked out the trend for the currency pair. With prices recently crossing below the moving average, this could mark a change in the overall trend, potentially heading lower.
Further, when looking at the long-term chart, the 1.440 level has been a critical point of support & resistance across its history, with prices often either breaking through with momentum or stopping and bouncing off this level.
Looking at each leg of the EURCAD against the USD also reveals an intriguing setup, with the USDCAD trading near the resistance of a descending channel and the EURUSD breaking sharply below its trend support. Both indicate a potentially lower EURCAD.
Another interesting comparison we can make is the currency pair with its related markets. Both the Euro and Canadian dollar are deeply tied to the USD; thus, the broad dollar proxy should have some relationship with the pair. By overlaying the inverse dollar index (DXY) and the EURCAD, we see both are closely related with the Inverse DXY pointing towards a slightly lower EURCAD. The same observation applies when we overlay the EURCAD and the Inverse Crude Oil prices, given the correlation of the Canadian dollar with crude prices due to its oil-exporting nature.
With CPI numbers out for both economies next week, it is also worth looking at the economic data from both countries. From an unemployment rate perspective, the Eurozone is faring worse than Canada, a trend echoed when we look at YOY GDP. Both indicators suggest a frail Eurozone economy, likely making the central bank more cautious as it tries not to overdo policy tightening and risk sending the Eurozone into a deep recession.
On top of that, the recent guidance from both central banks reveals slightly different undertones. The Bank of Canada anticipates higher year-over-year inflation readings, while the ECB forecasts declines in headline inflation and harmonised index of consumer prices (HICP) readings. This further supports the idea that the ECB might be more dovish, while the Bank of Canada could lean towards a hawkish stance.
All things considered, the case for a lower EURCAD seems compelling based on the technical charts at key levels, comparisons with other markets, and central bank stances. We could express this view via the CME-listed Euro/Canadian Dollar with a short position at the current level of 1.440, take profit at 1.380 and stop loss at 1.457, offering a risk-reward ratio of 3.5.
Alternatively, the currency pair can be synthetically constructed using the more liquid Euro FX Futures and Canadian Dollar Futures. To establish a short position on the EURCAD, one can sell 2 EURO FX Futures and buy 1 Canadian Dollar Future. This approach approximates the hedge for the position, considering that each EURO FX Futures contract represents 125,000 Euros, and each Canadian Dollar Futures contract corresponds to 100,000 Canadian Dollars. At the current exchange rate of roughly 1.44, 1 Euro FX Futures contract is equivalent to approximately 180,000 Canadian Dollars, resulting in a 2:1 ratio. Each 0.0001 per Euro increment for the Euro/Canadian Dollar Futures is 12.50 Canadian dollars, while each 0.000050 per Euro increment for the Euro FX Futures is $6.25 and each 0.00005 per CAD increment for the Canadian Dollar Futures is $5.00.
The charts above were generated using CME’s Real-Time data available on TradingView. Inspirante Trading Solutions is subscribed to both TradingView Premium and CME Real-time Market Data which allows us to identify trading set-ups in real-time and express our market opinions. If you have futures in your trading portfolio, you can check out on CME Group data plans available that suit your trading needs www.tradingview.com
Disclaimer:
The contents in this Idea are intended for information purpose only and do not constitute investment recommendation or advice. Nor are they used to promote any specific products or services. They serve as an integral part of a case study to demonstrate fundamental concepts in risk management under given market scenarios. A full version of the disclaimer is available in our profile description.
Reference:
thoughtleadership.rbc.com
www.ecb.europa.eu
www.cmegroup.com
www.cmegroup.com
www.cmegroup.com

Crude Oil Repeating the Pattern from 1985 to 2008I posted this pattern originally back in 2019 which showed the relationship between sharp drops in crude oil prices and the resulting support levels created in the stock market, as measured by the $SPX500 S&P500 Index.
Crude oil has basically gone sideways over the last 40 years when adjusted for inflation and when you factor in efficiency in that we get 22 mpg on average now in our vehicles vs closer to 10 mpg back in the early1980's. Essentially, the price of oil has only kept up with inflation.
When there is a spike in crude oil, it sets the seeds of its own destruction. We figure out how to use less and save more and find more oil. In this latest spike, there is a strong move again to save in the form of solar panels, battery storage and natural gas. Time will tell how the current pattern pans out.
The historical pattern suggests downside risk of 30%-40% for crude oil and upside of 200% which is a decent 10 year risk/reward ratio. If crude oil falls 20% from current levels near $84/barrel on 9/22/22, the risk/rewards gets extremely attractive as it drops to down 40%. The upside potential becomes 400% and the downside risk is 10% or less at that point.
Stay tuned!
Tim West
Key Hidden Levels Chat Room - Time@Mode Method specialist

CADJPY – holding for 109.50 While NOK (Norwegian krone) has the strongest statistical relationship with Brent and WTI crude, we can see a strengthening correlation between crude and the CAD. We see the 1-month correlation between crude and CADJPY at 0.68, so it's meaningful. We also see (on the daily) price breaking out of the top of its recent range of 108.50. While many will be concerned with being short JPY, given BoJ intervention risk, for now, traders remain happy to fade JPY strength as carry is still attractive (given the low volatility). Also, with crude on the rise the market sees this benefiting Canada’s terms of trade, while it negatively impacts Japan’s economics given, they are a big importer of energy. The bulls happy to hold for 109.50, stops on a daily close below the 5-Day EMA.

SpotCrude – higher levels starting to impact risk Further highs in crude have been seen in this momentum move. This time courtesy of some punchy OPEC forecasts for a 3.3m barrel p/d deficit in Q4. The IEA (International Energy Agency) are due to provide their update in the session ahead, and one can also expect a change in the forecast, given they previously pencilled in a 230k bpd deficit. $90 is the obvious round-number target for longs, ahead of the Oct 2022 highs of $93.52.
Clients are biased to fade the move here though (61% of open positions are now held short), but while crude is certainly overbought one considers the trigger for a pronounced mean reverting move. Higher levels from here are likely going to increase market anxiety, where we see inflation expectations rising once again.

CRUDE OIL Bullish Breakout! Buy!
Hello,Traders!
CRUDE OIL was trading in a
Bullish wedge and now we
Are seeing a bullish breakout
So I think that we will see
A strong move up
Buy!
Like, comment and subscribe to help us grow!
Check out other forecasts below too!

Crude Oil mouvement in 8/29/2023I advice my follower to not expect a significant movement in the crude oil futures market today, 8/29/2023. Crude oil prices are projected to fluctuate between $79.97 and $80.15.
