NATGAS WILL FALL|SHORT|
✅NATGAS made a retest of the
Strong horizontal resistance level of 3.150$
And as you can see the price is already
Making a local pullback from
The level which sends a clear
Bearish signal to us therefore
We will be expecting a
Further bearish correction
SHORT🔥
✅Like and subscribe to never miss
Related commodities

NG1!: Strong Bullish Sentiment! Long!
My dear friends,
Today we will analyse NG1!together☺️
The price is near a wide key level
and the pair is approaching a significant decision level of 3.016 Therefore, a strong bullish reaction here could determine the next move up.We will watch for a confirmation candle, and then target the n
Natural Gas Slips Below Support – More Downside Ahead ?
Recent candles are large-bodied bearish candles, indicating strong selling pressure.
Bollinger Basis is sloping downward, showing short-term bearish momentum.
Price is currently below both the 20-day and 50-day moving averages, reinforcing the bearish outlook.

NATURALGAS TRENDLINE BREAKOUT OR FAKEOUT?Timeframe: 1H Breakout Watch 🚀
Technical Overview:
Natural Gas is testing key horizontal resistance around 272 after multiple rejections. Price is holding above 25 EMA and 55 EMA, showing short-term bullish momentum.
Key Levels to Watch:
• Resistance: 272 – 274
• Breakout Target: 278 – 280 (if s

Gold | Oil | Dollar | Silver | Natural Gas Price ForecastGold | Oil | Dollar | Silver | Natural Gas Price Forecast
NYMEX:NG1! NYMEX:CL1! COMEX:GC1! COMEX:SI1!

NG FUT long setupNG FUT long setup
Entry - 260.8
Stop loss - 260
Target - 267.4
Risk Reward - 1:11.3

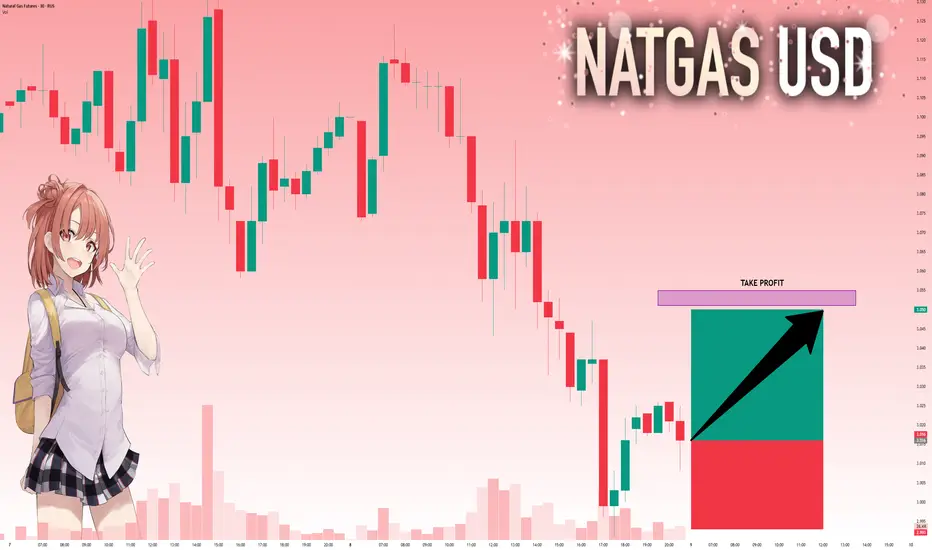
NATGAS The Target Is UP! BUY!
My dear friends,
Please, find my technical outlook for NATGAS below:
The price is coiling around a solid key level - 2.996
Bias - Bullish
Technical Indicators: Pivot Points Low anticipates a potential price reversal.
Super trend shows a clear buy, giving a perfect indicators' convergence.
Goal
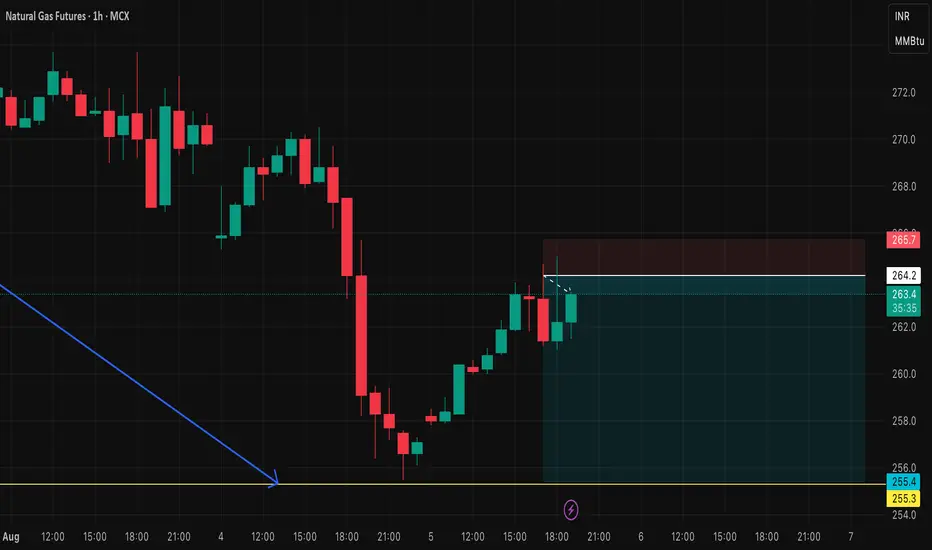
NF FUT short setupNG FUT short setup
Entry price - 264.2
Stop loss - 265.7
Target - 255.5
Risk Reward - 1:5.6
U.S. Natural Gas Poised for Rebound After Steep July DropU.S. natural gas prices sank in July due to mild weather, strong supply, and LNG export disruptions. The EIA cut its price outlook but expects a recovery by winter.
While technicals hint at a short-term rebound, oversupply and weak summer demand keep pressure on prices. A sustained recovery depends

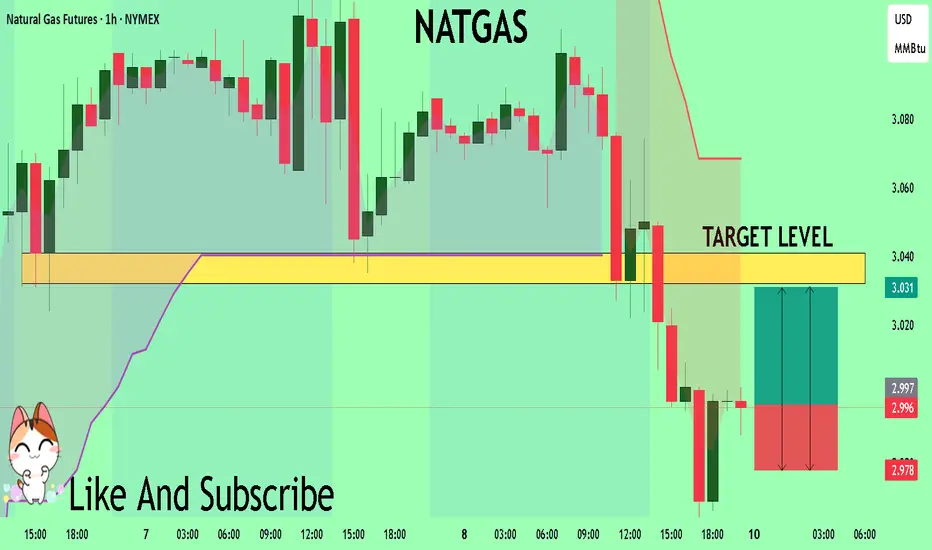
NG1! BUYERS WILL DOMINATE THE MARKET|LONG
NG1! SIGNAL
Trade Direction: long
Entry Level: 2.996
Target Level: 3.043
Stop Loss: 2.964
RISK PROFILE
Risk level: medium
Suggested risk: 1%
Timeframe: 1h
Disclosure: I am part of Trade Nation's Influencer program and receive a monthly fee for using their TradingView charts in my analysis.
✅LI

See all ideas
A representation of what an asset is worth today and what the market thinks it will be worth in the future.
Displays a symbol's price movements over previous years to identify recurring trends.