Natural Gas - Out of Gas?Blow off top marks the high for me. This chart is performing very technically as the B wave went right to the .886 fib today to trap as many bulls as possible. If we don't get higher above 4.77 again, I expect a rather long bleed out to the main trendline or support, whichever comes first.
You can buy DGAZ if you want to trade against it but beware as it is a 3x inverse ETF so please set appropriate stops. This could also be a Wave 3 which means after some consolidation/pullback we may see an even higher Wave 5 past 5 dollars. Please be careful in this market.
Good Luck!
DGAZ
A sharp drop is coming soonNatural gas reached 3.295 today, upped 19% in a month. It just the beginning of October, the weather is going mild in the next two or three weeks. So we will probably have another two or three weeks injections before the real winter coming. So i think it's still too early to chase that high, and the bulls are facing extremely high risk. Technically, we have already filled the gap at 3.295. MACD is over brought and nearly cross over. RSI is in over brought area. So i think the Natural Gas is facing a sudden correction before the winter.
Nat Gas pointing lower, towards 2,5xx levels - meaning DGAZ buy Apologies for not posting much lately, I have been travelling around the globe trying to catch some sun.
We have DGAZ in portfolio right now, went in at around $25 level, and will hold until $30 where my sell orders are now. This should go in line with projections my friends here on TV share with me - and that is the NG1! is going to enter 2,5xx area, hopefully 2,580 after which we should see a rise to at least 3,1xx at the time we start preparing for the winter weather and the end of the injection season.
If $30 seems fair fetched, exiting at $28.5 still gives some decent returns in this market which has been acting strange last 6 months.
Keep an eye out on entering longs on Nat Gas after we enter 2,5xx level.
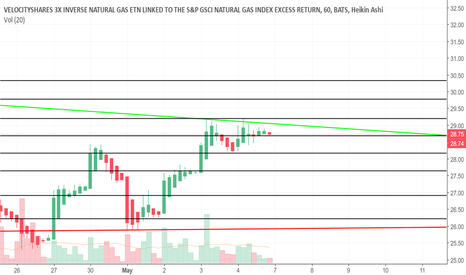
DGAZ Resistance/SupportUsually, I like to make my charts clean and simple, but for DGAZ, there are so many important levels, but they are very clear. DGAZ is showing consistently lower highs, so I wouldn't hold this as a long-term investment, but there are many intra-day opportunities for traders.
natural gasI have been trading these larger swing over the last few weeks and have been pretty accurate. Todays reversal was a happy site. But this pattern is anything but simple. I don't think we are in a typical short term, ABC due to the pattern. And there was a bullish divergence that appears to be starting to play out. The BBands on the daily are very very tight. Big move coming!
And this monthly chart below is showing a very large bullish divergence. From this long term view...this looking like a typical B wave pattern that we are working through. I really feel that we are close to making a move. With the BBands showing that we are about to make a very big move...I am biased with a move up to break out of this flag and complete the B wave.
GL
Natural Gas "my long term perspective"This is the monthly chart for Nat Gas. As you can see I think we are nearing the next push up to finish a large B wave. But if you look at the time frame...it could be a while until such a big move happens. Short term thought....I think we are going to be starting a 3rd subwave up soon. Hope this helps a little bit.
Natural Gas Ugaz DgazSo this wave count is nearly impossible to make out. But I believe that we are near the top of the beginning diagonal and should make a brief correction soon. I tried to get a measurement of the beginning of the wedge for a measured move down. Interestingly it is nearly perfect with a .618% Fib assuming I lined up with the correct bottom. The volume is nearly gone so that is another reason why I think we could get a brief drop before the big push up. So maybe sometime tomorrow I might sell ugaz and wait to buy the dip. GL
NATGAS Range Interesting Adam-Eve bottom pair potential.
Also, here are the levels that I'm watching. Anything could happen here, and would not be surprised to see it hit the bottom Green line or break above the resistance Red Line.
Short term support at black line.
Current position at Black line. Will continue to accumulate more if we come back to the black line, and double down on at the Green Line.
Swing Trade
Natural Gas "It just Dawned on me"I was laying on my couch thinking about NG and wondering what in the hell is going on with it. Then it dawned on me. After years of a bear market for natural gas, We are in a corrective ABC pattern. DUH, right. So then I was wondering about the last month of this uptrend and how complicated it was and thought, what if we had an ending diagnol for the A wave and we are now in the B wave. When I drew it, I saw how this drop over the last few days now made sense. SO assuming the drop has completed, we should get a zig zag moving up and then another drop and then a larger C wave up to higher highs. I would not be surprised if the zig zag moves up to the decending trend line. This makes the most sense for me right now. So I am in UGAZ for now. GL


