ES1! "E-Mini S&P500" Index Market Bullish Robbery Plan🌟Hi! Hola! Ola! Bonjour! Hallo! Marhaba!🌟
Dear Money Makers & Robbers, 🤑 💰💸✈️
Based on 🔥Thief Trading style technical and fundamental analysis🔥, here is our master plan to heist the ES1! "E-Mini S&P500" Index Market. Please adhere to the strategy I've outlined in the chart, which emphasizes long entry. Our aim is to escape near the high-risk Red Zone Level. Risky level, overbought market, consolidation, trend reversal, trap at the level where traders and bearish robbers are stronger. 🏆💸"Take profit and treat yourself, traders. You deserve it!💪🏆🎉
Entry 📈 : "The heist is on! Wait for the MA line breakout (5830.00) then make your move - Bullish profits await!"
however I advise to Place Buy stop orders above the Moving average (or) Place buy limit orders within a 15 or 30 minute timeframe most recent or swing, low or high level for Pullback entries.
📌I strongly advise you to set an "alert (Alarm)" on your chart so you can see when the breakout entry occurs.
Stop Loss 🛑: "🔊 Yo, listen up! 🗣️ If you're lookin' to get in on a buy stop order, don't even think about settin' that stop loss till after the breakout 🚀. You feel me? Now, if you're smart, you'll place that stop loss where I told you to 📍, but if you're a rebel, you can put it wherever you like 🤪 - just don't say I didn't warn you ⚠️. You're playin' with fire 🔥, and it's your risk, not mine 👊."
📍 Thief SL placed at the recent/swing low level Using the 4H timeframe (5600.00) Day/Swing trade basis.
📍 SL is based on your risk of the trade, lot size and how many multiple orders you have to take.
🏴☠️Target 🎯: 6100.00 (or) Escape Before the Target.
🧲Scalpers, take note 👀 : only scalp on the Long side. If you have a lot of money, you can go straight away; if not, you can join swing traders and carry out the robbery plan. Use trailing SL to safeguard your money 💰.
💰💵💸ES1! "E-Mini S&P500" Index Market Heist (Swing Trade Plan) is currently experiencing a neutral trend there is high chance for bullishness,., driven by several key factors. .☝☝☝
⚠️Trading Alert : News Releases and Position Management 📰 🗞️ 🚫🚏
As a reminder, news releases can have a significant impact on market prices and volatility. To minimize potential losses and protect your running positions,
we recommend the following:
Avoid taking new trades during news releases
Use trailing stop-loss orders to protect your running positions and lock in profits
💖Supporting our robbery plan 💥Hit the Boost Button💥 will enable us to effortlessly make and steal money 💰💵. Boost the strength of our robbery team. Every day in this market make money with ease by using the Thief Trading Style.🏆💪🤝❤️🎉🚀
I'll see you soon with another heist plan, so stay tuned 🤑🐱👤🤗🤩
Eminisp500


S&P 500 E-mini Futures: Bullish Momentum Meets Key Resistance📈 Technical Analysis: S&P 500 E-mini Futures (ES1!) – April 2025
🚀 Market Structure & Price Action for US500
The daily chart shows the S&P 500 E-mini Futures in a bullish recovery after a significant correction. The recent rally has pushed price back toward previous swing highs, an area likely to contain resting buy-side liquidity. This move suggests that the market is currently in a markup phase, but is now approaching a critical resistance zone where profit-taking and counter-trend activity may emerge.
🧠 Wyckoff Perspective
From a Wyckoff methodology standpoint, the recent price action resembles a classic accumulation-to-markup transition. The sharp selloff in March and early April appears to have formed a selling climax (SC) followed by an automatic rally (AR) and a secondary test (ST). The current advance could be interpreted as a sign of strength (SOS), but the proximity to previous highs raises the risk of an upthrust (UTAD) or a bull trap if supply emerges.
🌊 Liquidity & Potential Pullback
As price trades into the prior highs, it is likely "eating" buy-side liquidity—triggering stops and breakout orders. This process often leads to a liquidity sweep, where price briefly exceeds resistance before reversing as large players offload positions. If the market fails to sustain above these highs, a pullback or even a reversal could be initiated, especially if volume and momentum wane.
🌐 Market Sentiment & Fundamentals
Current sentiment remains cautiously optimistic, with the S&P 500 E-mini trading above 5,500 and recent sessions showing resilience despite mixed earnings and macroeconomic uncertainty. The broader market is supported by expectations of stable Fed policy and robust corporate earnings, but there are persistent concerns about inflation and global growth. According to Markets Insider, the ES futures are up 0.59% recently, reflecting a positive but not euphoric tone. However, as noted by Investing.com, there are signs the market could be setting up for a reversal if bulls fail to maintain momentum.
🛠️ Trade Ideas
🟢 Bullish Scenario: If price breaks and holds above the previous highs with strong volume and closes, consider a long entry targeting the next psychological resistance (e.g., 5,700–5,800). Place stops just below the breakout level to manage risk. This would confirm continued demand and a potential extension of the markup phase.
🔴 Bearish Scenario: If price fails to hold above the highs and forms a reversal pattern (e.g., bearish engulfing, upthrust), look for a short entry targeting the first support zone (e.g., 5,300–5,200). Stops should be placed above the failed breakout. This would align with a Wyckoff upthrust after distribution and a likely liquidity sweep.
⚠️ Disclaimer
This analysis is for informational purposes only and does not constitute financial advice. Trading futures involves significant risk and may not be suitable for all investors. Please conduct your own research and consult with a licensed financial advisor before making any trading decisions.

Liberation, Altercation or Doom? ES Futures weekly planCME_MINI:ES1!
Quick Update
The upcoming week is poised to be critical for financial markets as President Donald Trump's so-called "Liberation Day" on April 2 approaches. On this date, the administration plans to implement new tariffs aimed at reducing the U.S. trade deficit by imposing reciprocal duties on imports from various countries.
As April 2 looms, the full impact of these tariffs remains uncertain, leaving markets and investors in a state of heightened anticipation.
We may get clarity on the tariff situation on April 2, 2025.
Universal tariff announcement of categories of imports may clarify US administration’s maximum tariff escalation approach.
A phased out and unclear tariff approach may keep markets in limbo.
Economic Calendar
Keep an eye on the data docket, NFP and other key releases are due this week.
Tuesday, Apri 1, 2025 : ISM Manufacturing PMI, JOLTS Job Openings
Wednesday April 2, 2025 : ADP Employment Change, Factory Orders MoM
Thursday April 3, 2025 : Balance of Trade, Imports, Exports, ISM Services PMI, Initial Jobless Claims
Friday, April 4, 2025 : Non-Farm Payrolls, Unemployment rate, Average Hourly Earnings MoM,Average Hourly Earnings YoY, Fed Chair Powell Speech
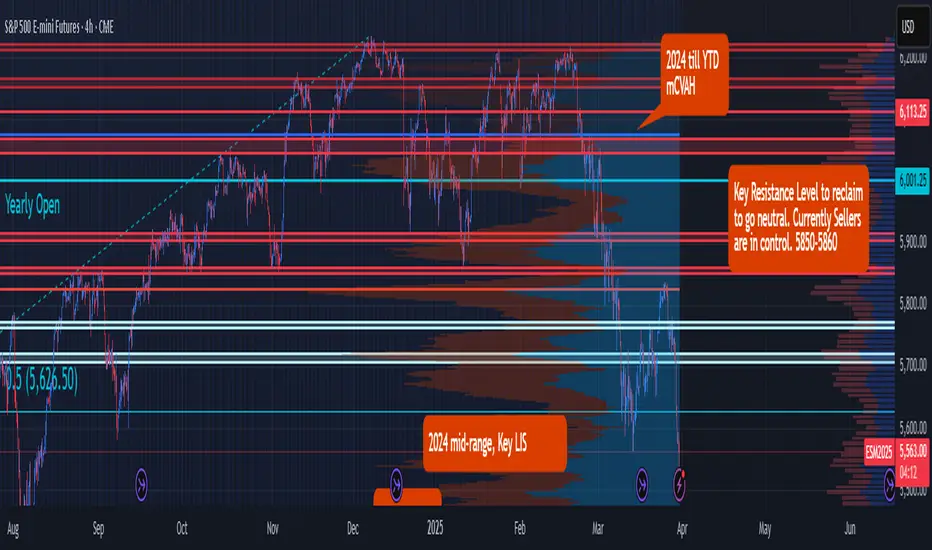
Key Levels to Watch:
Yearly Open 2025 : 6001.25
Key Resistance : 5850- 5860
LVN : 5770 -5760
Neutral Zone : 5705-5720
Key LIS Mid Range 2024 : 5626.50
2024-YTD mCVAL : 5381
2022 CVAH : 5349.75
August 5th, 2024 Low : 5306.75
Scenario 1: Bold but Strategic Tariffs (Effective Use of Tariff to reduce trade deficit and raise revenue) : In this scenario, we may see relief rally in ES futures, price reclaiming 2024 mid-range with a move higher towards key resistance level.
Scenario 2: Maximum pressure, maximum tariff (All out trade war) : In this scenario, we anticipate a sell-off with major support levels, such as 2024- YTD mCVAL, 2022 CVAH and August 5th, 2024 low as immediate downside targets.
Scenario 3: Further delays in Tariff policy (A negotiating tool, with looming uncertainty) : In this scenario, sellers remain in control and uncertainty persists, while we anticipate that rallies may be sold, market price action may remain choppy and range bound.
SP500 (E-mini Futures) - Decision TimeBigger Picture SP500 Futures Update - Decision Time
- Powell (FED) ruled out a recession in todays FOMC Press Conference (Bullish)
- Powell announced drastically slow down QT beginning next month (Extremely bullish for risk assets)
- The Asian and European stock market indices are still showing strength forming new ATHs week by week.

S&P 500 – Unstable Ground, Smart Money Seeks Stability🚨 S&P 500 – Unstable Ground, Smart Money Seeks Stability 🚨
“Markets don’t like uncertainty. Money flows where confidence is strong, and right now… that’s NOT here.”
🔥 Key Concerns:
✅ U.S. Policies Creating Instability – A crisis-driven environment shakes investor confidence.
✅ S&P Struggling to Hold Strength – Momentum is weak, smart money is hesitant.
✅ Blue Box = First Resistance Zone – A tough level to break, especially in this macro climate.
💡 The Game Plan:
Short Bias from the Blue Box – Until proven otherwise, this level is resistance.
LTF Breakdowns & CDV Confirmation = High-Probability Shorts – We don’t guess, we react.
No Clean Break Above? The Trend Remains Fragile.
“Markets punish uncertainty. Right now, the S&P is walking on thin ice—be cautious, be tactical.” 🔥📉
I keep my charts clean and simple because I believe clarity leads to better decisions.
My approach is built on years of experience and a solid track record. I don’t claim to know it all, but I’m confident in my ability to spot high-probability setups.
If you would like to learn how to use the heatmap, cumulative volume delta and volume footprint techniques that I use below to determine very accurate demand regions, you can send me a private message. I help anyone who wants it completely free of charge.
I have a long list of my proven technique below:
🎯 ZENUSDT.P: Patience & Profitability | %230 Reaction from the Sniper Entry
🐶 DOGEUSDT.P: Next Move
🎨 RENDERUSDT.P: Opportunity of the Month
💎 ETHUSDT.P: Where to Retrace
🟢 BNBUSDT.P: Potential Surge
📊 BTC Dominance: Reaction Zone
🌊 WAVESUSDT.P: Demand Zone Potential
🟣 UNIUSDT.P: Long-Term Trade
🔵 XRPUSDT.P: Entry Zones
🔗 LINKUSDT.P: Follow The River
📈 BTCUSDT.P: Two Key Demand Zones
🟩 POLUSDT: Bullish Momentum
🌟 PENDLEUSDT.P: Where Opportunity Meets Precision
🔥 BTCUSDT.P: Liquidation of Highly Leveraged Longs
🌊 SOLUSDT.P: SOL's Dip - Your Opportunity
🐸 1000PEPEUSDT.P: Prime Bounce Zone Unlocked
🚀 ETHUSDT.P: Set to Explode - Don't Miss This Game Changer
🤖 IQUSDT: Smart Plan
⚡️ PONDUSDT: A Trade Not Taken Is Better Than a Losing One
💼 STMXUSDT: 2 Buying Areas
🐢 TURBOUSDT: Buy Zones and Buyer Presence
🌍 ICPUSDT.P: Massive Upside Potential | Check the Trade Update For Seeing Results
🟠 IDEXUSDT: Spot Buy Area | %26 Profit if You Trade with MSB
📌 USUALUSDT: Buyers Are Active + %70 Profit in Total
🌟 FORTHUSDT: Sniper Entry +%26 Reaction
🐳 QKCUSDT: Sniper Entry +%57 Reaction
📊 BTC.D: Retest of Key Area Highly Likely
I stopped adding to the list because it's kinda tiring to add 5-10 charts in every move but you can check my profile and see that it goes on..

$spx going to 11k over the next 3 to 4 yearsIm expecting the current bull to continue for another few years, with a deep correction in between now and the expected target of 11 k, by 2028/29...
From there I expect SP:SPX to enter a sideways bear market such as the ones of 68/75 and 2000/2009 in order to form the 4th base of the secular run since 1929 (shown the comments).
Bears always get it wrong, because of their self-delusions about the world and often also themselves!
It's bulls who - due to their prescience and foresight - actually get to foresee tops in the market.
Bears never catch a top, if they do it's either by coincidence, luck or something a four year old could have seen, like the covid top... anyway... we see so much madness in the ideas section, it's even fun!

S&P500 (ES) uptrend may still be intactRecent price action on S&P futures suggests a potential rollover happening now, particularly after today's sell-off. This downturn began after the index peaked at 5,333.5 on April 1, 2024. Despite this, the upcoming Federal Reserve meeting and forthcoming high-profile earnings reports, such as NVDA's in late May, add layers of uncertainty. Notably, NVDA has recently become a pivotal indicator not only for the AI and broader tech sectors but also for the general economy.
Taking a longer-term perspective, the S&P futures have maintained an uptrend, connecting a support trendline from a previous low of 4,122 on October 27, 2023, to the April 19, 2024, pullback at 4,963. This suggests that the trend remains intact, possibly ready to rebound from the support line and continue its upward trajectory.
In conclusion, while recent market behavior might suggest the beginning of a rollover, the increased market volatility means that stricter interpretation of technical indicators may not be as reliable until the noise subsides. Therefore, a broader perspective might be necessary to accurately assess trend behaviors. But it's important not to continuously adjust this perspective to justify an ongoing uptrend, especially considering the seasonal strategy of 'sell in May and go away,' which could still prove prudent in the coming weeks.

07May'24 /// SP500 // ES Key zone 23.5 stm.ES again closed with Buyers in control and now we have the Strong Resistance Zone at (ES 5209-5219) where Sellers are likely to be active on 1st test.
Short-term Neutral-Bullish
Intermediate Neutral-Bearish

SP500// ES Key zone 23.6 stm.All Board market strength
But rally from OVN.
Let see the action on good location.

SP500// ES Key zone 26.9 stm.We have the initial Resistance zone which is the intraday Bias changing zone.
Where the market is going to move if ES/ SP500 holding below initial resistance following the FC announcement then the reason to weakness then could still remain in play for move down to initial support.
/////////////////
Short-term Neutral-Bearish
Intermediate Neutral-Bearish
/////////////////

Key zone SP500 - ES //27.25-point stmListen to the Market
opinions are typically wrong but the market is never wrong
Intermediate: Neutral-Bearish

SP 500 intermediate - Bearish Balancing after a large move is normal
we had 3 rotations down, tail and V reversal - possible end to big move
anything can happen next, so don't assume things
where are we in the days range?
where are we in the 8 day range?
how are other markets doing?

SP 500 Trade setup on broad market weakness.SP 500
SP 500 Trade setup on broad market weakness.
Stay hold below pre-market resistant.
So ideally wait to see break down pre-market support.
retrace and continue downside.

Trend Extend SPX short term futures bullThis algo and automatic drawing system can indicate that an oversold short term furtures index price can retrace to trend extend levels.
the projection in the algo and short term futures or money network index risk may accumulate according to trend regularity 33, with automatic drawings suggesting a cross.
a bear pullback could look like something as indicated on the chart, where the market overall USI:TICK SP:SPX $DXY/SPY is still a weekly sell.

Will NVDA Gap Hold for ES?E-mini S&P (June) / E-mini NQ (June)
S&P, yesterday’s close: Settled at 5062.25, down 30.25
NQ, yesterday’s close: Settled at 17,658.50, down 222.25
E-mini S&P and E-mini NQ futures finished lower for the fourth session in a row. Most crucially, the S&P tested our rare major four-star support at 5044-5055, this pocket aligns multiple indicators as well as the gap close on February 21st, ahead of NVDA’s earnings release. Given the relentless move down, failed bounce attempts and this critical area of support, it is imperative the bulls show up today.
Bias: Neutral/Bullish
Resistance: 5078-5082**, 5094-5097***, 5110*, 5119-5123.25***, 5127-5131.75***, 5147.25-5153.75***, 5162.75-5167.25***, 5182-5185.50**, 5207.75-5213***
Pivot: 5069.50-5075
Support: 5062.25***, 5044-5055****, 5026-5027.25**, 5018**, 4983.50-4994.25****
NQ (June)
Resistance: 17,767-17,796***, 17,850-17,874**, 17,959-17,988***, 18,051-18,072****, 18,131-18,167***, 18,226-18,254***, 18,326-18,343***
Pivot: 17,719
Support: 17,604-17,638***, 17,463-17,493***, 17323-17,372***, 17,106***
Micro Bitcoin (April)
Yesterday’s close: Settled at 61,130, down 1,790
Bias: Neutral/Bullish
Resistance: 63,350-63,700**, 64,660-64,937****, 66,555-67,595***, 68,172-68,590*, 70,410-70,800**, 71,795-71,815**, 72,110-72,530**, 73,410-73,600***
Pivot: 62,535
Support: 61,632-61,680***, 59,700-60,830***, 57,410-58.250***
Check out CME Group real-time data plans available on TradingView here: www.tradingview.com
Disclaimers:
CME Real-time Market Data help identify trading set-ups and express my market views. If you have futures in your trading portfolio, you can check out on CME Group data plans available that suit your trading needs www.tradingview.com
*Trade ideas cited above are for illustration only, as an integral part of a case study to demonstrate the fundamental concepts in risk management under the market scenarios being discussed. They shall not be construed as investment recommendations or advice. Nor are they used to promote any specific products, or services.
Futures trading involves substantial risk of loss and may not be suitable for all investors. Trading advice is based on information taken from trade and statistical services and other sources Blue Line Futures, LLC believes are reliable. We do not guarantee that such information is accurate or complete and it should not be relied upon as such. Trading advice reflects our good faith judgment at a specific time and is subject to change without notice. There is no guarantee that the advice we give will result in profitable trades. All trading decisions will be made by the account holder. Past performance is not necessarily indicative of future results.

Market crash to 3100 SPXLook out for a possible market crash down to 3100 SPX!!!
SP:SPX
AMEX:SPY
CME_MINI:ES1!

$spx geometric progressionpotential geometric progression for $spx since 2009 rally with flat 2018/2020 as mid point

/ES: End of Week Double Top Could Result In Secondary SelloffThe S&P 500 E-mini Futures appear to be double topping at around 4,835 as the end of the trading week approaches, this could result in an end of week selloff that continues into next week. The range in which it could sell off to on an intraweek basis is pretty wide. I would generally target the 800 EMA at around $4,678

S&P 500 Rally InboundOverall Order Flow is Bullish, And With this Market Maker Buy Model I see it rallying Today,
And with that Breaker in Mind I can see it Trading Down into that Creating a Judas Swing,


SNP likely flipping lower...looking for shorts on h1 etc...Hello fellow traders , my regular and new friends!
Welcome and thanks for dropping by my post.
Flipping on the index to the downside, correlating with the strengthening in USD?Let's see...
Do check out my stream video for the week to have more explanation in place.
Do Like and Boost if you have learnt something and enjoyed the content, thank you!
-- Get the right tools and an experienced Guide, you WILL navigate your way out of this "Dangerous Jungle"! --
*********************************************************************
Disclaimers:
The analysis shared through this channel are purely for educational and entertainment purposes only. They are by no means professional advice for individual/s to enter trades for investment or trading purposes.
*********************************************************************

March E-Mini S&P 500 Index Futures Weekly Chart - 12/18/23March E-mini S&P 500 Index futures continued the rally that began at the beginning of November, taking out the recent high from the last week in July. MACD recently experienced a bullish cross by crossing above its signal line. That relationship is widening, which indicates a continuing bullish trend. RSI is getting closer to being overbought at 70, though bearish divergence might be in play as the RSI is lower than its peak in August, even though price has taken out the high in August. This could indicate that momentum is weakening, and a reversal might occur. If the bullish trend continues, resistance might be found at the April 2022 high of 4,860. A reverse to the downside could find support at the 61.8% Fib level (4,530) and at the 52-week moving average (~4,400).
Please Note:
Commentary and charts reflect data at the time of analysis (12/15/23). Market conditions are subject to change and may not reflect all market activity.
