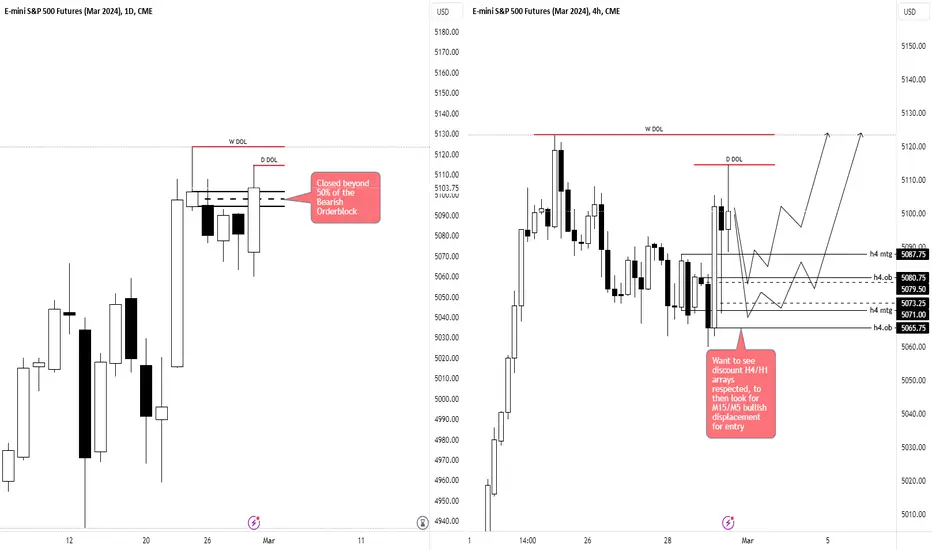
ES SP500 LongPrice had a strong daily close today.
Price disrespected the bearish orderblock by closing above it.
I want to see discount H4/H1 levels respected to then look for M15/M5 bullish displacement to trigger long.
Target PDH and PWH.
Es_f
3/1 Friday Trading PlanMarket Sentiment: Neutral
Trading Plan for Friday
Supports to Watch:
Immediate Supports: 5093, 5087, 5078-80 (major), 5066, 5058 (major), 5052, 5041-41 (major), 5031, 5028, 5018-22 (major), 5013, 5009, 5004, 4998 (major), 4988 (major), 4976, 4965, 4956-69 (major), 4947.
Resistances to Monitor:
Key Resistances: 5100-02 (major), 5108, 5113, 5120-24 (major), 5131, 5140 (major), 5150, 5155-57 (major), 5163, 5170, 5179-81 (major), 5188, 5196, 5200 (major), 5210 (major), 5214, 5220-25 (major), 5232, 5240 (major).
Trading Strategy:
Capital Preservation Friday: Prioritize capital preservation over aggressive trading today.
Limited High-Quality Setups: The market's recent price action limits the availability of clear, high-probability setups. Exercise caution and selectivity.
Disciplined Trading Within the Range: The 5108-5066 range defines the current market; employ disciplined, level-to-level trading strategies within this range.
Creative Approaches: The established range will require creativity in identifying trade opportunities.
Bull Case:
Trend Continuation: The bull market remains in control. Short-term focus is on the 5078-80 support level. Holding above this level primes ES for a breakout of the ongoing bull flag, targeting 5120-24 and potentially moving toward new all-time highs (5140, 5155-57).
Adding on Strength (Cautiously): Look for opportunities to add to positions, but proceed carefully due to limited visibility on setups. Overnight flagging above 5087, while remaining below 5113, may offer a constructive setup for direct upward movement.
Bear Case:
Support Failure: Breakdowns below 5078-80 trigger the bear case. Expect retests of the support level and consider shorting on failed bounces around 5076.
Breakdown Trades: Breakdown trades are risky (low win-rate, high reward potential). Proceed with caution or consider avoiding these setups if you find them unsuitable.
In Summary: Prioritize capital protection today. Maintain awareness of the trend but focus on trading within the established range using disciplined and creative approaches. If 5078-80 support fails, a potential shift in dynamics may require adjustments to your trading plan.
Top News for March 1, 2024
KeyCorp Earnings Calls Scheduled: KeyCorp has announced its schedule for quarterly earnings conference calls throughout 2024. Investors can access live audio webcasts via the company's investor relations website.
Biodesix Reports FY2023 Results: Biodesix, a leading diagnostic solutions provider, has released its financials for Q4 and FY2023, highlighting substantial growth in Lung Diagnostic test volume and a solid gross profit margin. The company projects significant total revenue growth for 2024.
Fox River Corporate Update: Fox River Resources Corporation has provided progress updates on its ongoing projects for 2024, including Battery Supply Chain Initiatives and Pilot Plant Phosphoric Acid Tests.
Financial Rule Changes Effective March 2024: Key financial changes are set to take place in March 2024, including GST rule updates, FASTag deactivation, and bank holidays. Additionally, the fiscal year 2023-24 will close on March 31.
Vanguard CEO Transition: Vanguard's CEO, Tim Buckley, who oversaw massive asset growth during his tenure, is stepping down.
Lordstown Motors Settles with SEC: Electric-truck maker Lordstown Motors has reached a settlement with the SEC regarding disclosure issues surrounding its SPAC deal.
Nasdaq Hits Record High: The tech-heavy Nasdaq composite index closed at an all-time high for the first time in over two years.
Dell's Outlook Boosted by AI Adoption: Dell's shares rose in response to bullish annual forecasts driven by increased demand for AI-optimized servers. This indicates AI adoption is a significant growth factor for enterprise technology suppliers.
Brazil's Q4 GDP Flat: Brazil's GDP in the fourth quarter of 2023 unexpectedly showed zero growth, missing market expectations slightly.
New York Community Bancorp Shares Fall: Shares in NYCB have declined due to the discovery of 'material weaknesses' in its loan review processes.
Disclaimer: Remember, this analysis serves an educational purpose; it should not be taken as financial advice. Always consult a financial advisor before making any investment or trading decisions.

2/29 Wednesday Trading PlanMarket Sentiment: Neutral
Indian and Global Market Updates
Mixed Indian Indices in Early Trading: The BSE Sensex and Nifty oscillated between gains and losses in a volatile morning session, mirroring muted global market cues and today's monthly derivatives expiry.
Reliance Industries, Maruti, and Others Lead Gains: Reliance Industries, Maruti, Titan, Mahindra & Mahindra, IndusInd Bank, and State Bank of India were among the top gainers on the Sensex.
Lagging Behind: Hindustan Unilever, Power Grid, Axis Bank, and Kotak Mahindra Bank were among the stocks underperforming.
Economic Outlook and Indicators
Elevated Recession Risk: Economist David Rosenberg warns of an 85% chance of a US recession in 2024, a high probability not seen since the 2008 crisis. His forecast is informed by a combination of financial conditions, debt-service ratios, foreign term spreads, and yield curve dynamics.
Bitcoin Soars: Bitcoin has reached record highs in Australian dollars and is closing in on an all-time US dollar high, driven by bullish momentum in the cryptocurrency market.
UK Economic Indicators Updated: Real-time indicators such as flight activity and London traffic data, as well as online job advert indices and automotive fuel spending insights, provide an update on the UK economy.
US Growth Forecast Revised Upward: The Atlanta Fed's GDPNow model increased its first-quarter 2024 real GDP growth estimate to 3.2%, up from 2.9% previously.
Data Revisions Announced: The US Census Bureau has informed that revisions will be made to the Wholesale and Retail adjusted and not adjusted monthly estimates released in March and April 2024, respectively.
News Highlights
Real Estate, Consumer Cyclicals, and Tech Advance: The real estate sector outperformed, followed by consumer cyclicals and technology, while utilities were the only sector showing losses.
Electronic Arts Announces Layoffs: Electronic Arts (EA) is cutting around 5% of its workforce and ending development on select video games.
Oprah Winfrey Exits WW International: Oprah Winfrey will step down from the board of WW International (former Weight Watchers) and plans to sell her stake in the company.
OpenAI Under SEC Investigation: The SEC is investigating possible misrepresentation to OpenAI investors, examining CEO Sam Altman's internal communications.
Oil Prices Dip Slightly: The global oil benchmark, Brent crude, saw a slight decline of 0.17% to $83.54 per barrel.
Trading Plan for Thursday
Supports to Watch:
Immediate Supports: 5074 (major), 5066, 5058, 5052 (major), 5040-42 (major), 5028-30 (major), 5018, 5013 (major), 5009, 4999 (major), 4988, 4981-83 (major), 4971, 4964, 4955-59 (major).
Resistances to Monitor:
Key Resistances: 5079 (major), 5087 (major), 5093, 5098, 5102, 5106-08 (major), 5113, 5118 (major), 5128, 5134-36 (major), 5142, 5150-52 (major), 5156, 5163, 5168-70, 5176 (major), 5182, 5190, 5195-5200 (major), 5209 (major), 5217, 5225 (major), 5230, 5235 (major).
Trading Strategy:
Range-Bound Market: The current market exhibits choppy, range-bound behavior. Exercise caution and focus on well-defined support and resistance levels to determine potential long or short entry points.
Inverse H&S Pattern in Play: An inverse head and shoulders pattern has formed since Monday's afternoon low, with 5074 as the neckline. Monitor this structure for potential directional clues, but acknowledge patterns offer only slight probability edges.
Disciplined Trading: Employ a disciplined trading strategy, including planned profit-taking and stop-loss orders, especially when testing significant support and resistance areas to manage potential market volatility.
Disclaimer: Remember, this analysis serves an educational purpose; it should not be taken as financial advice. Always consult a financial advisor before making any investment or trading decisions.

2/28 Wednesday Trading PlanTrading Plan for Wednesday, February 28, 2024
Market Sentiment: Neutral
Supports to Watch:
Immediate Supports: 5080, 5074 (major), 5066 (major), 5058, 5044-46 (major), 5028, 5018-22 (major), 5008, 5003 (major), 4998 (major), 4988, 4983, 4975 (major), 4965, 4954-58 (major), 4947, 4933 (major), 4917-20 (major), 4913, 4907 (major).
Resistances to Monitor:
Key Resistances: 5088 (major), 5093, 5102, 5108, 5113-5115 (major), 5127-29 (major), 5142, 5144-48 (major), 5158, 5168, 5171 (major), 5182 (major), 5193, 5204, 5215, 5225-30 (major), 5245 (major), 5260, 5272-75, 5290 (major), 5300 (major), 5308 (major).
Trading Strategy:
Maintain Cautious Approach: With the market at all-time highs, exercise caution and focus on well-defined technical levels as entry and exit signals.
Focus on Support and Resistance: Target key levels for possible long and short trade setups, paying careful attention to the critical 5074 support level.
Disciplined Trading: Employ a disciplined approach, including planned profit-taking and stop-loss orders. Do this particularly when testing primary support and resistance areas to manage potential market volatility.
Stock Market Outlook for February 2024
The stock market's bullish momentum from 2023 has continued into 2024, with the S&P 500 repeatedly making new all-time highs. Strong economic data and anticipation of the Federal Reserve potentially shifting to interest rate cuts are driving the market. Investors are watching for crucial economic data releases, earnings reports, and news events that could determine if the Fed will pivot its rate policy.
India's Economic and Market Updates
Strong Investor Confidence: India's deals market remains robust despite global headwinds, demonstrating continued business and investor optimism.
Positive Earnings Performance: CITI's India Equity Strategy report highlights that Q3 results, particularly in the auto, industrials, and energy sectors, have exceeded expectations.
Fundraising Initiative: Vodafone Idea has secured approval for a significant fundraising plan of up to ₹45,000 crore through a mix of equity and debt.
Byju's Legal Proceedings: The National Company Law Tribunal (NCLT) will issue a judgment on a case alleging investor oppression and mismanagement against Byju's.
Global Economic Concerns
Challenges to Global Growth: The global economy is pressured by ongoing crises, including continued conflicts in Ukraine and Gaza.
World Bank's Pessimistic Outlook: The World Bank's 2024 Global Economic Prospects report raises concerns about weak global growth.
Uncertain Economic Forecasts: Experts caution against placing too much confidence in economic forecasts, highlighting geopolitical risks and policy hurdles that might impede growth.
News Highlights
G20 Finance Ministers Meeting: Finance ministers from G20 countries are meeting to discuss support for the global economy, with the primary focus likely being on the war in Ukraine and the potential use of frozen Russian assets to provide aid.
Euro Area Economic Confidence: Economic confidence in the Euro area weakened unexpectedly, with a sentiment indicator declining to a three-month low.
Integra LifeSciences: Integra LifeSciences released financial results for both Q4 and the full year of 2023, and it also provided 2024 financial guidance.
NVIDIA's Results: NVIDIA reported results for the fourth quarter and fiscal year 2024, offering a positive outlook for the first quarter of fiscal 2025.
Silver Prices Decline: Silver prices have dropped as market participants await key US inflation data that could influence Federal Reserve monetary policy decisions.
Major Market Movers: Companies like Jindal Worldwide and Vodafone Idea have experienced significant stock price movements.
Disclaimer: Remember, this market analysis is intended for educational purposes and should not be taken as financial advice. Always consult a financial advisor before making investment or trading decisions.

2/27 Tuesday Trading PlanMarket Sentiment: Neutral
Stock Market Outlook for February 2024
The stock market's outlook leans toward neutral for February 2024. While the powerful year-end rally of 2023 created optimism, concerns linger that positive news has been priced in. This suggests potential vulnerability to negative news or persistent inflation throughout 2024.
Federal Reserve's Monetary Policy
The Federal Reserve ended its tightening cycle in December 2023, with expectations for significant rate cuts in 2024. Market concerns arise over the timing and scale of those reductions: should they occur primarily due to recession risks, or might the Fed hold off on the depth of cuts if the economy and inflation remain resilient?
US Economic Outlook
The U.S. economy in 2024 appears positioned for a potentially record-breaking late-cycle expansion. Inflation has cooled from 2023 highs, and corporate profits have stabilized. Challenges stemming from a slow Chinese economy and geopolitical tensions remain.
Investment Banks' 2024 Outlooks
Leading investment banks like Deutsche Bank, UBS, Apollo, and others offer varying perspectives on 2024. Their outlooks range from cautious optimism to focused identification of tactical opportunities within the equity markets.
Asset Markets and Valuations
Markets may become susceptible to adverse news or economic developments, as much good news may already be baked into current asset prices.
Corporate Earnings and Market Performance
Stocks have hit recent highs, fueled partly by excitement around the potential of AI to reshape the U.S. economy. Companies within the tech sector, such as Salesforce, HP, Workday, and Zoom, are among those releasing their latest earnings reports.
Global Market Overview
Globally, bonds underperformed equities early in the year as major central banks hinted at a more measured pace of interest rate cuts. The Fed Chair Jay Powell suggested a March cut was unlikely, and the UK's surprise inflation increase impacted UK gilts.
News Highlights
Retail Sector and Cryptocurrency: Macy's is reducing its store count due to decreased sales, while Bitcoin values have soared above $57,000 in a resurgence of cryptocurrency interest.
Corporate Developments: SunPower's CEO has stepped down amidst questions about the company's continued viability due to a credit agreement breach.
Trading Plan for Tuesday
Supports to Watch:
Immediate Supports: 5080-82 (major), 5074-76, 5066 (major), 5058, 5051, 5046 (major), 5040, 5031 (major), 5028, 5018, 5011-13 (major), 5004, 4998 (major), 4993, 4983 (major), 4965, 4951-56 (major).
Resistances to Monitor:
Key Resistances: 5093, 5102, 5108 (major), 5112 (major), 5121-23, 5134, 5143-46 (major), 5152, 5165 (major), 5170, 5178-81 (major), 5188, 5199, 5211, 5224 (major), 5229 (major), 5248 (major), 5257, 5270 (major), 5280 (major).
Trading Strategy:
Maintain Cautious Approach: After the strong rally, the market is in an expected cooldown phase. Exercise caution and seek clear technical signals for trades.
Focus on Support and Resistance: Target key support and resistance levels for potential long or short entry points, with particular attention to the critical 5046 level.
Disciplined Trading: Employ disciplined trading strategies, including planned profit-taking and stop-loss orders, especially when testing primary support and resistance zones to navigate potential market swings.
Disclaimer: It's important to remember that this analysis serves an educational purpose and shouldn't be taken as financial advice. Always seek professional financial advice before making investment or trading decisions.

2/26 Monday Trading PlanMarket Sentiment: Neutral to Bullish
📈 Trading Plan for Monday
Supports to Watch:
Immediate Supports: 5098, 5093 (major), 5079, 5073, 5066 (major), 5058, 5046-48 (major), 5040, 5028-32 (major), 5018 (major), 5013, 5003-05 (major), 4998, 4988 (major), 4984, 4976 (major), 4971, 4965 (major), 4956 (major), 4947-50 (major), 4942, 4934 (major).
Resistances to Monitor:
Key Resistances: 5110 (major), 5118-20, 5136, 5143 (major), 5150, 5160-63 (major), 5171, 5178 (major), 5183, 5194, 5213, 5219-22 (major), 5228, 5237, 5250, 5260, 5265-70 (major).
Trading Strategy:
Maintain Cautious Bullish Bias: The market leans bullish. Focus on reclaiming key resistances for potential recovery and further bullish momentum.
Disciplined Approach: Exercise disciplined and methodical trading principles with well-defined entry and exit points within the established support and resistance zones. Remain vigilant as CPI releases and earnings announcements could lead to market adjustments.
Tactical Insights: Prioritize planned profit-taking and stop-loss orders, especially when reclaiming important support and resistance zones. This allows you to manage market volatility and secure gains.
News Brief for Today
Stock Market Outlook for February 2024
The stock market's outlook leans toward bullish for February 2024. January's bullish momentum into new highs was fueled by healthy economic data and the anticipation of Federal Reserve rate adjustments. While market corrections are possible if earnings growth fails to meet lofty 2024/2025 expectations, the current climate remains favorable.
Federal Reserve's Influence
The Federal Reserve continues to have significant influence on the market. The FedWatch tool shows a 53% chance of a 25 basis point rate cut in March, highlighting the Fed's ability to shape expectations and broadly impact the economy.
Earnings Reports Insights
February earnings releases from tech, oil, and biotech titans like Apple, Amazon, and Exxon Mobil will provide essential insights into the strength of key sectors within the economy.
Economic Data Releases
Economic releases like the University of Michigan's Consumer Survey and the Fed's R-star estimate are important to consider as they are indicators of consumer confidence and interest rate perspectives.
HSBC's Financial Performance
HSBC's profit surge amidst elevated interest rates, despite headwinds from China's economic slowdown and a substantial charge associated with its Bank of Communications stake, highlights the multifaceted nature of global banking results and the interplay with macroeconomic forces.
Interest Rate Expectations
Market speculation centers around the possibility of nearly 5 rate cuts by the end of 2024. Investor sentiment is heavily influenced by anticipated Fed actions, making adjustments to these expectations a risk factor for both equity and fixed income markets.
Economic Growth and Inflation
The U.S.'s stronger-than-expected GDP growth and inflation cooling down present a cautiously optimistic economic picture; however, the Federal Reserve policy's full impact remains to be determined.
Global Economic Conditions
Lingering worries about inflation and potentially harmful economic news create a shadow over current asset prices, despite the recent rally. The global economic landscape, impacted by factors such as China's challenges and geopolitical tensions, adds to the complexities of market projections.
Nvidia's Booming Stock and High Pay: Nvidia's success turns it into a top Silicon Valley employer, attracting top talent with excellent compensation packages.
Treasury Markets Losing Shock Absorber: Changes in the U.S. Treasury market could impact liquidity and stability.
Li Auto's Sales Forecast: Despite reporting a surge in quarterly results, Li Auto, a Chinese electric vehicle maker, predicts softer sales.
U.K. Housebuilders Under Investigation: Potential information sharing practices among U.K. housebuilders are under the scrutiny of the country's competition watchdog, which could have implications for the housing sector.
Warren Buffett and the Japanese Market Rally: Berkshire Hathaway was invested during the Japanese stock market rally, with possible effects for investors and the market as a whole.
Fed's Inflation Gauge and Rate Cuts: Expectations are rising for the Federal Reserve's inflation gauge, and business economists surveyed by NABE anticipate rate cuts to start in June.
TSMC Opens First Plant in Japan: The opening of TSMC's first Japanese plant marks a major development within the semiconductor industry.
India's Navi Mumbai Airport Challenges: Adani Airport Holdings is struggling to convince major airlines to switch operations from Mumbai to the new Navi Mumbai airport.
Asset Monetization in India: In FY25, the Indian government's asset monetization program is projected to hit record highs, with major contributions from railways and other sectors.
S&P/TSX Composite Index Performance: The S&P/TSX composite index closed positively on Friday, representing a snapshot of the current state of the Canadian stock market.
U.S. Economic Outlook: Economists are revising their outlook on the U.S. economy in 2024, forecasting higher growth, diminishing inflation, and healthy job creation, straying from previous recession concerns.
Global Economic Data Releases: Upcoming global manufacturing PMI data, U.S. core PCE, and GDP reports from various nations will offer a comprehensive understanding of the current state of the global economy.
Disclaimer: It's important to remember that this analysis serves an educational purpose and shouldn't be taken as financial advice. Always seek professional financial advice before making investment or trading decisions.

2/23 Friday Trading Plan
📈 Market Sentiment: Neutral to Bullish
SPX Outlook for February, 23 2024:
Bullish Momentum: The S&P 500 exhibited a bullish trend into January 2024, reaching new highs driven by strong economic indicators and expectations of Federal Reserve rate adjustments. Nevertheless, there are concerns about potential market corrections if earnings growth fails to meet the lofty expectations for 2024 and 2025.
Federal Reserve's Influence: The FedWatch tool signals a 53% likelihood of a 25 basis point rate cut in March, underscoring the Federal Reserve's pivotal role in molding market expectations and its extensive economic implications.
Earnings Reports Insights:
Sectoral Performance: February's earnings disclosures from leading entities in technology, oil, and biotechnology sectors provide a holistic view of various economic segments' health. Companies like Apple, Amazon, and Exxon Mobil are in the limelight.
Economic Data Releases:
Key Indicators: The emphasis on data such as the University of Michigan's Consumer Survey and the Federal Reserve's R-star estimate mirrors the market's sensitivity towards consumer confidence and interest rate projections.
HSBC's Financial Performance:
Profit Surge: HSBC's notable profit increase amid high interest rates, despite the headwinds from China's economic deceleration and a significant charge from its stake in the Bank of Communications, illustrates the intricate relationship between global banking performance and macroeconomic factors.
Interest Rate Expectations:
Market Speculation: The anticipation of nearly 5 rate cuts by the end of 2024 significantly sways investor sentiment, dependent on forthcoming Federal Reserve decisions. However, shifts in these anticipations pose risks to equity and fixed income markets alike.
Economic Growth and Inflation:
GDP and CPI Dynamics: The U.S.'s unexpected robust GDP growth coupled with a gradual inflation deceleration points towards a cautiously optimistic economic forecast, albeit the comprehensive impact on Federal Reserve policy is yet to be ascertained.
Global Economic Conditions:
Inflation and Growth Concerns: Persistent inflation and potential adverse economic developments overshadow asset prices, in spite of the recent market rally. The global economic landscape, marked by challenges in China and geopolitical tensions, adds complexity to market prognostications.
📈 Trading Plan for Wednesday:
Support Levels to Watch: Immediate supports at 4981 and 4965 serve as short-term defenses against further declines. Upholding these levels may indicate buying opportunities or short-term market steadiness.
Resistance Levels to Monitor: Crucial resistances at 4988 and 4996-98 act as pivotal points for market recovery or additional bullish momentum. Overcoming these thresholds could fortify the bullish scenario.
Trading Strategy: The current market tone is bearishly inclined, with a possibility for brief recovery endeavors around pivotal resistance levels.
Disciplined Approach: Concentrate on disciplined entry and exit strategies within the designated support and resistance zones.
Tactical Insights: Prioritize systematic profit-taking and loss-cutting, especially around significant support and resistance levels, to adeptly navigate potential market volatility and leverage discernible trends.
🛑 Disclaimer: This analysis serves educational purposes only and does not constitute financial advice. Consult a professional financial advisor before making any trading decisions.

#ES_F Day Trading Prep Week 2.18 - 2.23Shortened week ahead, lets break down structure and areas of interest to lean on this week.
Last Week :
We opened the week above VAH and under Key HTF Edge, we knew that this is the area where we can see size sellers step in and an area where size longs could be taking profits which creates different sets of sellers to give more pressure to the lower levels, as mentioned this could be the Edge that will stop our run at least for time being.
Market consolidated above VAH, pushed into the Edge, tagged 5066.50 to the tick and failed to take it out which gave a nice sell back into VAH. Tuesday before the data we knew we had Supply trapped above and if Key Support gets taken out we can see a move lower and if we followed down level to level we ended up testing the bottom Edge, taking out one of the weak lows but we only had enough to barely take it and found buying again. By end of the week we ended up back in 5013.75 - 5066.50 Range and Friday we balanced inside under the Key Resistance without tagging it and with a few Key Support tests.
This Week :
Market closed on Friday inside Key Support with what looked like end of day break but Globex opened and pushed away from Key Support again keeping us inside 5013.75 - 5066.50 Range for now. We have a shorter week coming and question is will we stay consolidating in this Current Range and try to push out of VAH towards the Edge again or will the market stay inside Value with a possible move through the Mean towards VAL.
If we end up holding under VAH under 5048.75 - 45.75 // 34-31 areas could bring in weakness once enough supply builds up to break Current Key Support and if that happens we could target move to lower levels towards VAL, we have to be careful looking for too much downside unless Key Levels break and market shows continuation because we could stay balancing inside our Value unless stronger volume comes in. First targets under to watch would be 5001.75 - 97.75 and VAL top at 4988.25 - 84.25 which could find buying to hold us over, if not we have Key Support at 4972 - 67 which we would need to take out for any continuation towards bottom Edge.
If we do end up holding this range and can't take out Current Key Support, we can see more balance in Current range again and if enough buying comes in and we can take out upper Resistance areas at 5034-31 we would need to hold over 5041.50 and take out 5048.75 - 45.75 to see another attempt at the upper Edge. We would need to take out and accept over 5066.50 - 60.75 for any more upside from this range and above target would be towards the top of the Edge where we could watch for failure or continuation.
Area over 5066.50 - 60.75 is big Resistance for now and if we finally have selling from size longs and shorts don't need to pay over Value too much then we could continue to hold under so need to be careful with any pushes over 34 - 41.50 area as they may not hold unless we get strong buying through them.
Levels to Watch :
Current Resistance 5034 - 31 // 5048.75 - 45.75
Key Resistance 5066.50 - 60.75
Targets if above 5086.25 - 81 - 77.75
Current Key Support 5019 - 13.75
Targets below 5001.75 - 97.75 // 4988.25 - 84.25 Needs to break for attempt lower
Key Support 4972 - 67 Would need to hold under for any continuation towards lower Edge.

2/22 Thursday Trading Plan📊 Market Sentiment: Neutral
Nvidia's Earnings Impact:
Exceptional Performance: Nvidia's Q4 and fiscal 2024 earnings showcase transformative growth in AI and data center sectors. The company's revenue and EPS have significantly exceeded expectations, sending shares soaring and valuing Nvidia at $1.7 trillion.
Market Response: The 10% rise in Nvidia shares post-earnings, coupled with a 40% year-to-date surge, underscores the market's bullish outlook on AI-driven growth. Nvidia's forecasts for continued robust demand further buoy investor sentiment.
Trading Plan for Thursday:
Support Levels to Monitor:
Immediate Supports: 4971 and 4965, with major considerations at 4954-56 and 4944-48. These levels represent potential buying opportunities or signify short-term market stabilization.
Strategic Supports: 4925 and 4906 for knife-catching long positions, emphasizing caution and the need for systematic profit-taking.
Resistance Levels for Potential Rebounds:
Key Resistances: 4976-78 and 4989, marking thresholds for market recovery or further bullish momentum. Reclaiming these levels could reinforce the bull case scenario.
Tactical Approach:
Flexibility Post-Earnings: Nvidia's earnings release necessitates a flexible trading strategy, prepared to adapt to post-announcement volatility and potential traps.
Systematic Trading: Focus on disciplined trading around support and resistance zones, with a readiness to capitalize on post-earnings market dynamics.
Strategic Insights:
Prioritize systematic profit-taking and cautious entry around major support reclaims, navigating potential volatility with a disciplined approach.
🚫 Disclaimer: This analysis is for educational purposes only and does not constitute financial advice. Always consult with a professional financial advisor before making trading decisions.

2/21 Wednesday Trading Plan📉 Market Sentiment: Bearish
Stock Market Outlook for February 2024:
Bullish Momentum: The S&P 500's bullish trend into January 2024, reaching new highs, fueled by strong economic indicators and anticipations of Fed rate adjustments. However, concerns loom over potential market corrections should earnings growth not meet the high expectations set for 2024 and 2025.
Federal Reserve's Influence: The FedWatch tool indicates a 53% probability of a 25 basis point rate cut in March, spotlighting the Federal Reserve's critical role in shaping market expectations and its broader economic impact.
Earnings Reports Insights:
Sectoral Performance: February's earnings from giants across technology, oil, and biotech sectors offer a comprehensive view into the health of different economy sectors, with notable companies like Apple, Amazon, and Exxon Mobil under the spotlight.
Economic Data Releases:
Key Indicators: The focus on releases such as the University of Michigan's Consumer Survey and the Fed's R-star estimate reflects the market's sensitivity to consumer confidence and interest rate perspectives.
HSBC's Financial Performance:
Profit Surge: HSBC's significant profit increase amidst high interest rates, despite challenges from China's economic slowdown and a substantial charge from its Bank of Communications stake, underlines the complex interplay of global banking performance and macroeconomic factors.
Interest Rate Expectations:
Market Speculation: With nearly 5 rate cuts anticipated by the end of 2024, investor sentiment is heavily influenced by future Fed actions, though adjustments in these expectations pose risks to both equity and fixed income markets.
Economic Growth and Inflation:
GDP and CPI Dynamics: The U.S.'s stronger-than-expected GDP growth and the gradual slowdown in inflation highlight a cautiously optimistic economic outlook, though the full impact on Federal Reserve policy remains to be seen.
Global Economic Conditions:
Inflation and Growth Concerns: The persistence of inflation and potential negative economic news casts a shadow over asset prices, despite the recent rally. The global economic landscape, including challenges in China and geopolitical tensions, adds layers of complexity to market forecasts.
📈 Trading Plan for Wednesday:
Support Levels to Watch:
Immediate Supports: 4981 and 4965, acting as short-term bulwarks against further declines. The defense of these levels could signal buying opportunities or short-term stability.
Resistance Levels to Monitor:
Key Resistances: 4988 and 4996-98, representing critical thresholds for market recovery or further bullish momentum. A successful breach could reinforce the bull case scenario.
Trading Strategy:
Short-Term Bearish Bias: Given the recent dip, the market exhibits a bearish tone, with potential for short-term recovery attempts around key resistance reclaims.
Disciplined Approach: Focus on disciplined entry and exit points within identified support and resistance zones, prepared to adapt to market dynamics post-CPI release and earnings announcements.
Tactical Insights:
Emphasize systematic profit-taking and loss-cutting, particularly around major support and resistance reclaims, to navigate potential market volatility and capitalize on identifiable trends.
🛑 Disclaimer: This analysis is for educational purposes only and is not financial advice. Always consult a professional financial advisor before making any trading decisions.

2/19-2/20 Monday and Tuesday Trading PlanApologies for the formatting today. TradingView has a formatting bug in their editor and this is the only way to publish until it's been resolved. Market Sentiment: Neutral to Bearish Vanguard's Economic Outlook: U.S. Consumer Health: Entering 2024, U.S. consumers remain financially healthy, potentially bolstering or stabilizing economic growth despite recession risks. S&P 500 Earnings Growth: Earnings Expectations: Wall Street's anticipation of double-digit earnings growth in 2024 and 2025, with the risk of market corrections if these expectations are not met. Stock Market Performance: Bullish Momentum: The S&P 500's continued growth into January 2024, reaching new highs amid a robust U.S. economy and mixed earnings reports. Federal Reserve's Interest Rate Outlook: Speculation on Rate Cuts: Market optimism for potential Fed rate cuts in 2024, tempered by analysts' caution over premature expectations. Tech Stock Valuations: Sustainability Concerns: Warnings about the sustainability of gains in major technology stocks, given their valuations. S&P 500 Milestone: Historic High: The index breaking above 5,000, signaling investor optimism and potential for further gains. Asian Currencies and Fed Rate Cuts: Currency Impacts: Potential benefits for certain Asian currencies from anticipated Federal Reserve rate cuts. France's Economic Growth Outlook: Growth Revision: France's lowered economic growth outlook for 2024, with implications for President Macron's economic strategy. European Banks' Profits: Record Profits: European banks' profits exceeding 100 billion, largely benefiting from rising interest rates. Regulatory Actions: Property and Tech Regulations: Expected UK curbs on short-term property rentals and EU fines on Apple, reflecting regulatory trends. Trading Plan for Monday/Tuesday: Support Levels to Watch: Critical Supports: 5016-18 and 4998, serving as pivotal points for market stability and potential shifts. Resistance Levels to Watch: Key Resistances: 5046-48 and 5055-58, acting as barriers to upward market movements and indicators of sentiment shifts. Trading Strategy: Holiday Session Caution: Emphasis on cautious trading during low volume holiday sessions, with a focus on capital preservation and disciplined trading within identified support and resistance levels. Tactics: Focus on disciplined trading within identified support and resistance levels, prepared to adapt quickly to market dynamics, especially in light of holiday sessions and OPEX Fridays. Disclaimer: This analysis is for educational purposes only and is not financial advice. Consult a professional financial advisor before making any trading decisions.

#ES_F Day Trading Prep Week 02.11 - 02.16Lets check out market structure from last week and see what we can lean on this week.
Last Week :
Last week started off at VAL of current HTF Range, market opened Sunday over Key area but wasn't able to hold over which provided sells back towards the Edge but was only able to hit a couple lower targets before it found more buying at and over the Edge which told us we weren't ready to continue lower from there. Once we got over and held 72-67 area as Support which brought in more buying, we took out 88-84 Resistance which trapped shorts below and gave a nice push towards higher targets. We hit resistance at Key Area of 5019-13.75 but market again wasn't able to get back under the mean and instead we created a cost basis, got over Key Resistance and pushed to test VAH. First VAH Test in Pre-market gave a nice sell back into previous Key Resistance but failed to break making it our Support, once selling over 28.50-34 area ran out we were able to continue to next level up at 48.75-45.75 which provided Resistance for the day.
This Week :
So far Friday market was able to hold VAH and gave a push over it end of day. Going into this week we have a Cost Basis at the Mean area of the HTF Range and we have our Key HTF Edge right above us which is a great spot for profit taking from size longs.
This to me is kind of hinting on possible balance action inside our new range which is 5013.75 - 5066. Cost Basis at the Mean could provide the needed Support and the selling from/under the Edge could provide the needed resistance to keep us inside this range until we either have enough Supply/Volume to break back under and continue towards VAL or give another consolidation and if more buying comes in try to push through the Edge.
I feel like this Edge is the one that will kind of stop this train from going further, of course we never know and can continue if buying comes in but if not this is a perfect spot for market to find good HTF Resistance and start a distribution process under it filling in the shorts who got trapped on the way up, holding the market here will also bring in new buyers as well who will be looking for continuation higher towards 5100 but if they aren't strong enough to actually push us through this area then that would be our Supply when we are ready to accept back in Value and head for VAL. This might take time to play out and wont be surprised if we spend the whole week in this current Range without acceptance over/under for now. We could see tests out of Key areas but need to be careful for continuations from them.
I will be looking to trade back and forth level to level inside this 5066 - 5013.75 Range until I see acceptance over/under.
Levels to Watch:
Current Resistance 5048.75 - 45.75
Key Resistance 5065.75 - 60.75
IF Accept Over Next Level up is 5077.75-81 Area
Current Support 5034 - 31 - 28.50 Area
Key Support 5019 - 13.75
Would need to hold under to see anything lower
IF it does levels under are 5001.75 - 4997.75 // 4988-84.25

2/15 Friday Trading Plan📊 Market Sentiment: Neutral to Bearish
OPEX Day = High Volatility
Things could go either way today, so exercise extreme caution. I do not trade on OPEX days. The last hour of the trading session will be a determining factor on where we're headed next week.
Stock Market Outlook:
Earnings Growth Expectations: Wall Street's anticipation of double-digit earnings growth for the S&P 500 in 2024 and 2025, coupled with the risk of a significant correction if these expectations are not met, underscores the market's current optimism and potential volatility.
Federal Reserve's Rate Cut Speculation: The bullish momentum of the S&P 500 is partly driven by expectations of a Federal Reserve pivot, yet concerns arise that the market may be overly optimistic about the timing and justification of rate cuts.
U.S. Consumer Spending:
Sustained Strong Spending: Despite the surge in household debt, strong consumer spending supported by job gains and lower inflation fuels speculation about a potential "soft landing" in 2024.
Federal Reserve and Inflation:
Progress on Inflation: The Federal Reserve's actions have led to a reduction in inflation levels, though still above the target, raising speculation about possible rate cuts in response to economic conditions.
Recession Risks:
High Recession Probability: Rosenberg's prediction of an 85% chance of a recession in 2024 based on comprehensive economic indicators highlights the underlying risks in the current economic environment.
Global Economic Outlook:
Challenges to Global Growth: Tight monetary policy and geopolitical uncertainty continue to pose risks to global economic growth, with specific challenges facing economies like Japan and expectations of subdued global growth in 2024.
Asian Markets:
Wall Street's Rally Influence: Asian shares, particularly Japan's Nikkei, reflecting Wall Street's rally despite Japan's economic contraction, emphasize the interconnectedness of global markets.
Corporate News:
Semiconductor Sector Optimism: Applied Materials Inc.'s bullish revenue forecast highlights the sector's growth potential amid increased investments in semiconductor production.
Energy and Commodities:
Oil Price Fluctuations: The slight declines in U.S. benchmark crude and Brent crude prices reflect the ongoing volatility in the energy market.
Currency Markets:
Dollar's Movement: The U.S. dollar's performance against major currencies underscores the currency market's sensitivity to economic data and policy decisions.
📈 Trading Plan for Friday:
Support Levels to Watch:
Key Supports: 5010 and 4998-5000, serving as crucial points for gauging market stability or signaling potential shifts.
Resistance Levels to Watch:
Critical Resistances: 5046-48 and 5063-65, acting as barriers to upward market movements and indicators of potential shifts in sentiment.
Trading Strategy:
OPEX Friday Caution: The emphasis on capital preservation and cautious trading in light of OPEX Friday and the recent market rally.
Bull Case: Monitoring the market's ability to maintain above key support levels for a continued rally, with an eye on reclaiming resistance levels for sustained momentum.
Bear Case: Preparation for a downward trend should key support levels, particularly 4998-5000, fail to hold, signaling deeper market corrections.
Tactics:
Focus on disciplined trading within identified support and resistance levels, prepared to adapt quickly to market volatility and OPEX day dynamics.
🛑 Disclaimer:
This analysis is for educational purposes only and is not financial advice. Consult a professional financial advisor before making any trading decisions.

2/15 Thursday Trading Plan📊 Market Sentiment: Neutral to Bearish
U.S. Economic Projections:
Rosenberg's Recession Warning: Forecasts an 85% chance of a recession in 2024, highlighting financial conditions and the yield curve as critical indicators.
Global Economic Outlook:
Tight Monetary Policy Impact: The World Economic Situation and Prospects report underscores the impact of tight monetary policy and geopolitical uncertainty on global growth.
Japan's Economic Status:
Shift in Global Rankings: Japan's economy contracted, marking a technical recession and positioning it as the world's fourth-largest economy.
Stock Market Movements:
Market Optimism vs. Volatility: Despite recent gains, there's caution over volatility and market corrections tied to central bank actions.
Cryptocurrency Market:
Bitcoin's Resurgence: A significant recovery for Bitcoin, reflecting renewed investor confidence in cryptocurrencies.
Corporate Earnings and Job Cuts:
Mixed Corporate Sentiment: A strong earnings season faces pressure from potential rate cut delays and job cuts in response to economic conditions.
Inflation and Monetary Policy:
Central Bank Challenges: Inflation data has led to uncertainty about the Federal Reserve's rate cut timeline, impacting markets and treasury yields.
Geopolitical Tensions:
Stability Concerns: Ongoing conflicts and tensions underscore the importance of geopolitical stability for economic confidence.
📈 Trading Plan for Thursday:
Support Levels to Watch:
Key Supports: 5010, 4998-5000, and 4984, serving as crucial points for maintaining current market stability or signaling potential shifts.
Resistance Levels to Watch:
Critical Resistances: 5018 and 5034-36, acting as barriers to upward market movements and indicators of potential shifts in sentiment.
Trading Strategy:
Post-Inflation Data: The unexpected inflation report necessitates a cautious trading approach, with emphasis on navigating potential volatility.
Bull Case: Monitoring the market's ability to maintain above 5010 and potentially reclaim key resistance levels for a continued rally.
Bear Case: Preparation for a downward trend should key support levels, particularly 4998-5000, fail to hold, signaling deeper market corrections.
Tactics:
Focus on disciplined trading within identified support and resistance levels, prepared to adapt quickly to market volatility following economic data releases.
🛑 Disclaimer: This analysis is for educational purposes only and is not financial advice. Consult a professional financial advisor before making any trading decisions.

2/14 Wednesday Trading Plan📊 Market Sentiment: Neutral to Bearish
U.S. Economic Projections:
Congressional Budget Office (CBO) Outlook: Projects a slowdown in 2024 with a potential rebound in 2025 as the Federal Reserve lowers rates. The 2024 deficit is anticipated to be smaller than previously estimated, indicating a cautious approach towards monetary policy.
Stock Market Performance:
Inflation's Impact: Unexpectedly high January inflation led to significant market corrections, with the Dow experiencing a notable drop. Tech stocks, including giants like Apple and Amazon, were particularly affected.
Interest Rates and Inflation:
Federal Reserve's Stance: The anticipation of the Fed's rate cuts has been postponed due to the inflation report, affecting Treasury yields and the overall market sentiment.
Investment Trends and Strategies:
2024 Outlook: Analysts remain cautiously optimistic, with AI in finance, digital currencies, and sector-specific strategies being highlighted as key investment trends.
Corporate News and Global Market Trends:
Corporate Movements: Notable acquisitions and earnings reports, such as KKR's stake in Cotiviti and ABN AMRO's profit beat, influence market dynamics. Global shares showed mixed responses to U.S. inflation data.
Recession Concerns and Geopolitical Factors:
Economic Risks: Ongoing geopolitical conflicts and concerns over a potential recession in 2024 continue to pose uncertainties for the global economy.
📈 Trading Plan for Wednesday:
Support Levels to Watch:
Critical Supports: 4928-33 and 4956, serving as pivotal points for market stability or indicating potential downward trends.
Resistance Levels to Watch:
Key Resistances: 4969-71 and 5018, acting as barriers to upward movement and indicators of market sentiment shifts.
Trading Strategy:
Post-Inflation Report: Given the market's reaction to the inflation data, traders should adopt a cautious approach, prioritizing capital preservation.
Bull Case: Focus on the market's ability to reclaim key resistance levels, particularly 5018, for a potential rally towards 5057 and beyond.
Bear Case: Prepare for further declines if support levels, especially 4928-33, fail to hold, potentially signaling deeper market corrections.
Tactics:
Emphasize disciplined trading within identified support and resistance levels, with readiness to adapt to market volatility post-inflation report.
🛑 Disclaimer: This analysis is for educational purposes only and is not financial advice. Always consult with a professional financial advisor before making trading decisions.

2/13 Tuesday Trading Plan📊 Market Sentiment: Neutral to Bearish
Catalyst:
The latest CPI results will be released this morning at 8:30 AM (EST).
U.S. Economic Projections:
Congressional Budget Office (CBO): Forecasts slower economic growth in 2024 with unemployment rising due to tight monetary policy, but expects growth rebound in 2025 as Federal Reserve lowers interest rates.
Global Stock Market Movements:
Fluctuations observed with the S&P 500 reaching record highs, driven by optimism and big tech performance. Nikkei 225 also sees significant gains.
Interest Rates and Inflation:
Inflation easing may lead Federal Reserve to begin rate cuts later in the year, fostering hope for resolution against inflation.
Investment Trends and Strategies:
Trends focus on AI's impact on finance, performance of digital and cryptocurrencies, and outlook for tech and ESG funds.
AI in Finance:
Vanguard incorporates AI into quant stock funds, highlighting the trend of AI integration into investment strategies.
International Developments:
Prime Minister Narendra Modi's engagements in the UAE and Qatar aim to deepen bilateral ties.
Corporate Bonds and Insurance:
U.S. investment-grade corporate bonds expected to offer impressive returns in 2024, while insurers may focus on margins over growth.
UK Market and Employment:
The UK's unemployment rate falls, indicating a tight job market. Wage growth and unemployment trends remain critical.
📈 Trading Plan for Tuesday:
Support Levels to Watch:
Critical Supports: 5034, 5018-20, and 4959, indicating pivotal points for maintaining bullish momentum or indicating potential bearish shifts.
Resistance Levels to Watch:
Key Resistances: 5048-50, 5057, and 5070-76, serving as potential targets for upward movement or reversal points for bearish trends.
Trading Strategy:
CPI Day Caution: Emphasize capital preservation, acknowledging potential volatility from CPI data release.
Bull Case: Focus on holding above 5018-20 for bullish continuation, eyeing targets at 5057 and 5076-80.
Bear Case: Watch for breach below 5018-20, indicating a shift towards bearish sentiment and potential deeper sell-off.
Tactics:
Emphasize disciplined trading within identified support and resistance levels, with cautious engagement in new positions given expected market volatility from CPI data.
🛑 Disclaimer: This analysis is for educational purposes only and is not financial advice. Always consult with a professional financial advisor before making trading decisions.

2/12 Monday Trading Plan📊 Market Sentiment: Neutral
Economic Data Releases:
S&P Global Market Intelligence: Anticipated inflation and GDP data across Western economies, with U.S. CPI figures, UK GDP, inflation, labor market statistics, and Japan's GDP data in focus.
Australia's Employment Data: Expected to show job growth, albeit at a softer pace.
Market Sentiment and Indices:
S&P Global Investment Manager Index: To provide insights into risk sentiment influenced by central bank policies, notably the Fed.
S&P/TSX Composite Index: Watched closely alongside Canadian dollar and benchmark yield movements.
Corporate News:
Galp Energia SGPS SA: Warned of lower earnings for the year.
Gilead Sciences' Acquisition: Announced a $4.3 billion deal for CymaBay Therapeutics.
Market Movements:
S&P 500: Indicating a strong bull market since October 2022 with 10 new highs in 16 days.
Diamondback Energy's Acquisition: A significant $26 billion deal with Endeavor Energy Resources.
Commodity Prices:
Silver and Gold Prices: Declined amidst diminished expectations of Fed rate cuts.
Global Market Updates:
US Equities: Reached a more than two-year peak despite regional bank concerns and China’s market pressures.
China's Consumer Prices: Highlighting deflation pressures with the fastest pace decline since the global financial crisis.
Financial Services News:
Oil Market: Observations on investors dumping oil following a U.S. refinery shutdown.
U.S. Treasury Market:
Treasury yields dipped as key economic data and Federal Reserve officials' comments are awaited.
📈 Trading Plan for Monday:
Support Levels to Watch:
Critical supports at 5039-40, 5028, and 5018-20, indicating pivotal points for maintaining bullish momentum.
Resistance Levels to Watch:
Key resistances at 5047, 5054, and 5065-70, serving as potential targets for upward movement.
Trading Strategy:
The strategy emphasizes capital preservation, acknowledging the chop range and potential for volatile movements.
Bull Case: Focus on maintaining above 5028 for bullish market continuation.
Bear Case: Watch for breach below 5028, indicating potential shift towards bearish sentiment.
Tactics:
Emphasize disciplined trading within identified support and resistance levels, with cautious engagement in new positions given the expected market chop.
🛑 Disclaimer: This analysis is for educational purposes only and is not financial advice. Always consult with a professional financial advisor before making trading decisions.

2/9 Friday Trading Plan📊 Market Sentiment: Neutral
Global Market Update: Steady European and U.S. stock-index futures amidst anticipation for U.S. inflation data signal cautious market sentiment.
Canada-EU Trade Talks: Potential impact on trade dynamics and market sentiment could emerge from discussions at the CETA Joint Committee in Brussels.
📝 Today's Recap:
Canadian Economic Data: Upcoming jobs numbers and senior loan officer survey results are likely to influence market perspectives on Canada's economic health.
Earnings Reports: Earnings from Enbridge Inc., Telus Corp., Magna International Inc., and PepsiCo Inc. offer insights into sector-specific performances.
🌍 Global Financial and Economic News:
Sports Betting Legislation: The slow legalization process in states like California and Missouri impacts the betting market and related sectors.
Tesla's Elon Musk Compensation: Court ruling on Musk's compensation package raises discussions on executive remuneration and company performance correlation.
📉 Support Levels to Watch:
5009, 5000-4999, 4990: Key supports, with a focus on maintaining above 4990 for bullish market continuation.
📈 Resistance Levels to Watch:
5018, 5035, 5050: Critical resistances, indicating potential targets for upward movement if bullish momentum persists.
📅 Trading Plan for Friday:
Approach: Capital preservation with minimal trading, acknowledging the current chop range and potential for volatile movements.
Bull Case: Maintaining above 5000 signals continued bullish sentiment, targeting upward movements towards 5028 and beyond.
Bear Case: Breach below 5000 may indicate a shift towards bearish sentiment, with potential for a pullback to lower support levels.
Tactics: Emphasize disciplined trading within identified support and resistance levels, with cautious engagement in new positions given the expected market chop.
🛑 Disclaimer: This analysis is for educational purposes only and is not financial advice. Always consult with a professional financial advisor before making trading decisions.

2/8 Thursday Trading Plan📊 Market Sentiment: Neutral
RBI Monetary Policy (February 2024): Keeping repo rates unchanged indicates RBI's cautious stance on inflation, impacting market sentiment and future interest rate expectations.
Banking and Financial Services Trends (2024): AI's growing influence, interest in digital currencies, customer experience focus, and cybersecurity concerns shape the financial sector's future.
📝 Today's Recap:
Economic Trends and U.S. Financial Landscape (2024): Observations from SIEPR on economic challenges and policy questions, alongside investors' focus on Federal Reserve's decisions, provide insights into potential market directions.
Global Economic Updates: Interest rate decisions by global central banks, including the Bank of England and the Federal Reserve, alongside China's economic strategies, offer a broad perspective on global market trends.
🌍 Global Financial and Economic News:
U.S. Jobs Report and Economic Growth: Strong job additions and GDP growth reflect economic resilience, potentially influencing Federal Reserve's future rate decisions.
Danske Bank and CaixaBank Strategies: Strategic moves and forecasts by major banks underscore the banking sector's adaptability and future growth prospects.
📉 Support Levels to Watch:
5009, 4990, 4984 (Major), with a focus on 4984 as a critical support for maintaining the current market rally.
📈 Resistance Levels to Watch:
5018, 5035, 5048 (Major), indicating potential targets for upward movement if the market maintains its bullish trend.
📅 Trading Plan for Thursday:
Approach: Cautious trading strategy amidst ongoing market analysis, with an emphasis on responding to key support and resistance levels.
Bull Case: Maintaining support at 4984 crucial for the continuation of the market rally; targeting upward movements towards 5018 and beyond.
Bear Case: Watch for failure at 4984 as an indication of potential market correction; short opportunities arise if major supports are breached.
Tactics: Prioritize level-to-level trading, with a focus on major support and resistance levels for high-probability setups and disciplined profit-taking.
🛑 Disclaimer: This analysis is for educational purposes only and not financial advice. Market conditions are dynamic; consult with a professional before making trading decisions. Risk management is essential.

2/7 Wednesday Trading Plan📊 Market Sentiment: Neutral to Bearish
U.S. Jobs Report (January 2024): Significant job additions indicating robust economic activity, potentially affecting Fed's interest rate decisions.
Federal Reserve's Interest Rate Decision (January 2024): Rates held steady, with future cuts indicated, impacting investor sentiment and market strategies.
Innovation Economy and Geopolitical Risks: Influential trends and uncertainties shaping market dynamics and investment decisions.
📝 Today's Recap:
Housing Market and Supply Chain Developments: Challenges in housing affordability and ongoing adjustments in global supply chains are key factors affecting market trends.
Stock Market Outlook and Banking Sector Movements: Continued bullish momentum with caution advised due to potential interest rate cuts and strategic moves in the banking sector.
🌍 Global Financial and Economic News:
Global Economic Trends and Financial Services News: Insights into economic challenges, policy questions for 2024, and strategic moves by financial institutions shaping the financial landscape.
📉 Support Levels to Watch:
4970, 4962-65, 4956, 4947 (Major), 4939, 4930-34, with particular interest in 4930-34 and 4909 for potential long positions.
📈 Resistance Levels to Watch:
4977, 4982, 4990-93 (Major), 5007, 5018, with emphasis on 4990-93 and 5018 for potential short positions or caution areas.
📅 Trading Plan for Wednesday:
Approach: Cautious trading strategy amidst forming bull flag pattern and awaiting clear market direction post-job report and Fed's decision.
Bull Case: Support at 4947 and 4962-65 pivotal for maintaining upward momentum; targeting moves towards 4977 and 4990 upon successful base building.
Bear Case: Watch for failure at 4962-65 as an early warning, with significant attention on 4947 for potential deeper retracement or short setups.
Tactics: Prioritize trading within the identified range, with a focus on high-probability setups and strict discipline around major support and resistance levels.
🛑 Disclaimer:
This analysis is for educational purposes only and not financial advice. Market conditions are dynamic; consult with a professional before making trading decisions. Risk management is crucial.

2/6 Tuesday Trading Plan📊 Market Sentiment: Neutral to Bearish
Economic Positivity vs. Recession Risks: Ongoing discussions about potential economic slowdown amidst optimistic indicators.
U.S. National Debt: Concerns over $34 trillion debt and its sustainability.
Gold Prices: Driven to all-time highs by geopolitical tensions, banking uncertainties, and Fed's interest rate policies.
Layoffs and Job Market: Over 720,000 layoffs signal caution among employers.
Housing Market: Expected slight increase in median home prices.
📝 Today's Recap:
Housing Market and Fed Policies: Fed's steady interest rates amid rising housing costs.
China's Stock Market: Rally following government's increased stock purchases.
Corporate Earnings: Meta's earnings growth and dividend introduction.
Banking Sector: AI's transformative potential in banking for 2024.
🌍 Global Financial and Economic News:
Investment Trends for 2024: Forbes highlights AI's impact on the financial sector.
Financial Market Outlooks: Diverse predictions for 2024, from stock valuations to GDP expectations.
📉 Support Levels to Watch:
4965, 4954, 4947 (Major), 4942, 4930, 4915, 4908
Notable for potential bids: 4930 and 4908-4915 cluster.
📈 Resistance Levels to Watch:
4970, 4986-4990 (Major), 5018, 5028-5033
Key for potential shorts: 4986-4990 and 5028-5033 zones.
📅 Trading Plan for Tuesday:
Approach: Conservative post-rally strategy, focusing on high-probability setups within the new base range.
Bull Case: Maintain supports at 4965 and 4947 for base building; target upward moves to 4990 and beyond on breakouts.
Bear Case: Watch for failure at 4947, signaling deeper retracement; consider shorts on breakdowns with tight risk management.
Tactics: Emphasize level-to-level trading, particularly around 4965 and 4947 supports, and 4986-4990 resistance for potential reentries or reversals.
🛑 Disclaimer:
This analysis is for educational purposes only, not financial advice. Market conditions are dynamic; consult a professional before making trading decisions. Risk management is essential.

2/2 Friday Trading Recap📊 Market Sentiment: Neutral
Federal Reserve's Steady Rate: Maintaining rates signals a balanced approach towards inflation and economic growth.
Tech Sector's Performance: Upcoming earnings from tech giants could sway market direction significantly.
📝 Today's Recap:
Interest Rate Decision: The Federal Reserve's choice to keep rates unchanged points to a cautious but optimistic outlook on inflation and economic growth.
Tech Earnings: Anticipated earnings reports from leading tech companies will be critical for market sentiment early next week.
🌍 Global Financial and Economic News:
Interest Rate Projections: Speculation on future rate cuts based on inflation trends and economic indicators.
Tech Sector Impact: The tech industry's performance, particularly earnings reports, will play a pivotal role in market dynamics.
📉 Support Levels to Watch:
4977, 4963-65 (Major), 4954, 4945 (Major)
Strategy: Monitor these levels for potential buying opportunities, especially after a significant uptrend.
📈 Resistance Levels to Watch:
4990-95 (Major), 5016-18 (Major), 5040
Approach: Exercise caution around these levels; consider taking profits or reassessing positions.
📅 Trading Plan for Monday:
Preparation: Following a significant rally, anticipate a period of price discovery and potential consolidation.
Bull Case: Key supports at 4963-65 and 4954 must hold to sustain the uptrend.
Bear Case: A break below 4963-65 could indicate a short-term pullback or consolidation phase.
Tactics: Prioritize setups with clear risk-reward profiles, focusing on major support and resistance levels.
🛑 Disclaimer: This analysis is for educational purposes only. Market conditions are dynamic; consult with a financial advisor before making trading decisions.

2/1 Thursday Trading Plan📊 Market Sentiment: Bearish
Federal Reserve's Rate Decision: The Fed's decision to maintain interest rates influences market expectations and strategies.
Economic Slowdown Concerns: Predicted slower growth rate impacts market dynamics.
Tech Giants' Earnings: Influence of Microsoft, Alphabet, and other tech companies on market sentiment.
📝 Today's Recap:
Strong U.S. Economy: Growth defies recession fears but is tempered by the Fed's cautious stance.
China's Financial Challenges: Market impacts of China's economic difficulties.
Corporate Earnings: Insights into the tech sector's performance based on earnings reports.
🌍 Global Financial and Economic News:
Fed's Interest Rate Policy: Market reactions to the Federal Reserve's decision to maintain rates.
Mortgage Rate Trends: Implications of decreased mortgage rates for the housing market.
Job Market and Tech Layoffs: Interplay between strong job market and recent layoffs in the tech sector.
📉 Support Levels to Watch:
4874, 4860-65 (Major), 4847, 4841 (Major)
4832 (Major), 4824, 4817, 4811
📈 Resistance Levels to Watch:
4878 (Major), 4888, 4890-92 (Major)
4898, 4904-02 (Major), 4912 (Major)
📅 Trading Plan for Thursday:
Strategy for Volatile Market: Adapt to potential volatility following the Fed's decision.
Bull Case: Focus on reclaiming key levels to resume an upward trend.
Bear Case: Monitor for further breakdowns below support levels.
Action Plan: Evaluate supports and resistances, adjust strategy based on market reactions to Fed's decisions.
🛑 Disclaimer: This analysis is for educational purposes only and is not financial advice. Consult a professional financial advisor for trading decisions.
