Eurusd-3

🎓 EDUCATION 2: STOP Trading (Only) with Technicals ❌Happy Thursday traders! It’s time to continue with our Educational Series on how to become a successful trader with a professional trading approach. It's holiday season, and closed markets mean more time to sharpen our trading skills! Let's go...
In the last post, we touched on the main ingredients of a successful trader (check the link to "related idea"). Let’s reinforce those again:
1. Market Analysis – Your “Analyst” side. Here, you are going to combine Fundamentals, Intermarket analysis, Sentiment analysis, and (the correct) Technical analysis (FIST approach).
2. Trading – Your “Trader” side. Once the analyst in you spots a promising trade idea, the trader in you is responsible to execute the trade with proper entry and exit levels.
3. Management – Your “Manager” side. Every trader is a risk manager. Your manager side is responsible to manage your trade and risk levels, scale in and out of positions, open the correct position sizes, evaluate the reward-to-risk of your trades, etc.
Alright, so far we are still covering your “Analyst” side. Your analyst side determines whether you will buy EURUSD, sell GBPJPY, buy gold, and sell silver. It’s the part of your trading that constantly scans for profitable trade ideas and setups in the markets, and passes them on to your “Trader” side.
Why You Shouldn’t Rely on Technical Analysis?
The majority of new traders I see in the retail space place too much attention on technical analysis. They search the internet for TA articles, look for the “holy grail” indicator, read dozens of technical analysis books, but still don’t manage to improve their trading performance.
The truth is, they don’t understand the markets. I don’t care how many TA books you’ve read in your entire life, if you don’t understand how markets work and what moves prices up and down, you won’t succeed as a trader.
Unfortunately, almost every retail trading website promotes and publishes those articles, because they are attracting clicks of inexperienced traders.
Here is a hint: When I worked in the trading department of a large European bank, I didn’t even look at charts. There are almost no charts and no indicators on the trading floors of big banks and hedge funds!
Do you really think that banks will move hundreds of millions into a trade because the 50-day MA crossed the 100-day MA, or because the price formed a Head & Shoulders pattern? The first time you do this in a bank will likely be your last day as a professional trader.
So why do retail traders trade like that? Because they don’t know of better ways to trade. No one has taught them that trading based purely on technical analysis will never work. It’s in nobody’s interest to teach you this because large market participants need the “dumb money”. Yes, they make a profit when you trade badly and lose money.
So, what’s moving the market if it’s not technicals?
The Forex market is the marketplace for the world’s currencies, and currencies are influenced by supply and demand. To be more precise, interest rates influence currencies, with higher interest rates increasing demand for a currency (therefore leading to higher prices) and lower interest rates decreasing demand for a currency (therefore leading to lower prices.)
We as Forex traders are interest rate traders. We trade currencies based on (short-term) views about their future interest rates. For example, let’s say the market expects higher inflation rates (inflation represents the change in the price of goods and services during a year) in Australia, which could lead to a response from the Reserve Bank of Australia by hiking interest rates. This will create demand for the AUD (remember, global capital is always chasing yield), which in turn would lead to a higher exchange rate of the AUD.
If you only followed technicals and identified a bearish divergence on the RSI in AUD/USD - and you entered short - it’s your fault. The pair would likely move higher on higher interest rate expectations in Australia.
So, when do technical levels work? When the market trades in fair value (in fundamental equilibrium), you’ll find that simple technical rules work. If large market participants agree that the current exchange rate of a currency pair is “fair” given the current fundamentals, smaller players may move the market when the price reaches a support or resistance level, or when the price breaks above or below a triangle. Unfortunately, markets are always in a state of flux and rarely in equilibrium, so following other analytical disciplines (besides technical analysis) will improve your trading performance dramatically.
This chart shows the Band of Agnosticism. This band represents a span of exchange rates where fundamental-based traders are unlikely to join the market because the market is already in a fundamental fair-value zone. As the exchange rate starts to approach the upper or lower band, fundamental-based traders (which happen to be large banks and hedge funds) start considering opening new positions. The volume of their orders pushes the price back inside what is considered fair value.
Professional traders first look at a variety of other factors before they decide what currency pair they want to trade. Once we identify a good trading candidate (our “Analyst” side does that), then it’s time to open the chart and find areas where we could enter with a long position (and those are not trendline breakouts!)
We will cover all of this, step by step, in the coming Educational posts.
Don't forget to FOLLOW to receive all future trade ideas and educational posts!
Happy holidays everyone. 🎆

Moving Average DeviationYou probably remember the bell curve back from school which shows the normal distribution of statistical data.
Set the MA Deviation to percentage.
Draw a line at 2 per cent.
Anytime the indicator goes above 2 we can say we are in a volatile market.

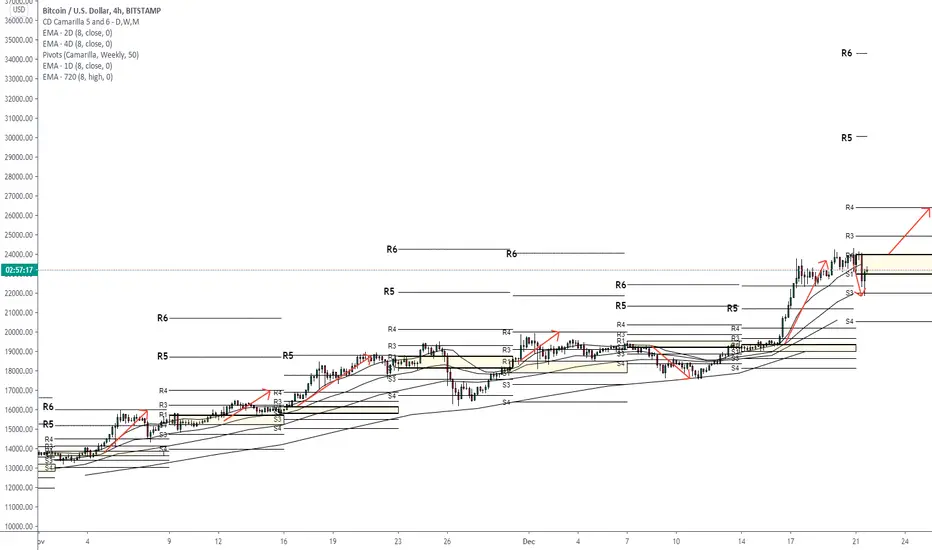
How to use Camarilla Opening Range Hello traders, Here I shall demonstrate you how you can use Camarilla Weekly Opening range S1 to R1 (in tradingview, otherwise Camarilla levels are marked with H1,2,3,4,5,6 (High) and L1,2,3,4,5,6 (for Low).
-------------------------------------------
If day, week or month opens and price start trending ABOVE Camarilla Opening Range you look for LONGS, targetting 1. R3 2. R4 3. R5. R5 Final target after breakout of R4, as price rarely makes it to R6 during a week / month. Usually I never target R6 - this is quite unrealistic target (though it might work in supervolatile instruments as bitcoin).
If day, week or month opens and price start trending BELOW Camarilla Opening Range you look for shorts with targets as above.
-------------------------------------------
You can use Moving averages (best static ones - multitimeframe that do change when you flip charts) to confirm entries.
This system is similiar to Mark Fisher´s Opening Range using the open instead of close (which are typically the same, as candle usually opens where it closed).
This should greatly improve your trading as you will have REALISTIC VOLATILITY BASED TARGETS based on previous close, high and low.
Good luck!
Is the US Dollar dying or dead?In this very busy chart, I compare 6 forex pairs. It needs some study. What seems clear to me is that the USD strength has been heading south manly since March 2020.
This is not unexpected of course, following the FED's money-printing spree, now called QE infinity. I'm not here to say whether that's a good thing or a bad thing.
The overall effect of a weak USD is to keep the US stock indices afloat. I'm not saying that is an intended effect of what the FED is/was doing.
I think the effect is dangerous on both Bond and Stock markets, because at some point people or banks are gonna wake up and wonder 'What's the value of money?'. In a sense that's already happening, as in other posts I've shown that there is movement of value into metals and Bitcoin.
The above are speculative opinions that may well be wrong. This means that you ought not to make decisions based on anything I say.
Disclaimers : This is not advice or encouragement to trade securities on live accounts. Chart positions shown are not suggestions. No predictions and no guarantees supplied or implied. Heavy losses can be expected if trading live accounts. Any previous advantageous performance shown in other scenarios, is not indicative of future performance. If you make decisions based on opinion expressed here or on my profile and you lose your money, kindly sue yourself.

How to trade XRP. 3 Best and simpliest trading strategies. My Friend. Here will be the best patterns that work on Crypto and XRP:
1. False break out of key level
- U should wait for a pullback to a strong key level.
- Better when a false breakout happens after 100% of ATR drop.
example
2. Wage patten
This BNB trade is the best example.
We made 3% within 1 day))
3. Squezeeng to a key level
The best example will be on EUR/USD but it also works on Crypto and XRP.
I just showed you 3 best examples of how can buy XRP. Wait for one of these scenarios.
My Friends, if u want to learn how to trade crypto and make money on it write to us about education. Below this video will be a link which u can use for it. Because we closed the last 2 weeks with 80% of the profit. You also can learn how to do it.

How to use MTF T-Line (8 EMA)T-Line stands for Trigger Line and is 8 EMA, concept invented and taught by American trader Steven Bigalow.
He uses daily 8 EMA and stays in trades as long as price is above or below 8 daily ema. If price closes below or above 8 daily ema in the opposite direction he exits.
I went further with this concept, implementing Multitimeframe 8 ema trading system which is very effective. For that one needs indicator able to plot higher resolution EMAS on lower resolution charts (Moving Average Collection by Wataru Inoue can do that - www.mql5.com - better than TradingvIew MTF ma function). But you need a powerful PC (8 GB RAM at least) as many PC freeze when applying MTF indicators especially on many charts.
For exits, reversal or entries you may add Pivots (Camarilla, Fibonacci Pivots seem to be most effective resistance support levels, especially longterm ones yearly, monthly, weekly). But you are free tp use Ichimoku, daily, monthly, weekly highs, lows or whatever level tools convinient.
At least this system will help you to stay on the right side of the market. This sytem works well with gold, oil, sp500, eurusd, btcusd and many other pairs.
Good luck my friends!

🎓 EDUCATION 1: What Does It Take to Become a Successful Trader?EDU 1: What Does It Take to Become a Profitable Trader?
Hello traders. With this post, I am starting an educational series on TradingView unlike any other. We’ll go through all the aspects and nuances of becoming a professional, consistently profitable, and successful trader.
Now, those are big words. You have likely heard them from various other sources that claimed to teach you the holy grail of trading or that offered some sorts of “secret indicators” that would pave the way to financial freedom.
The truth is, nothing is secretive about successful trading. Thousands of professional traders are consistently profitable, and large institutional traders manage to beat the markets, year over year. The key is learning how to trade the correct way. That’s my trading approach as well: Institutional trading for the retail trader.
I have been fascinated by the markets since the early 2000s. I am not only a self-taught trader, but also have an academic background that has helped me tremendously in understanding market forces and applying them in my daily trading.
I enrolled at the Faculty of Economics in 2008, finished my undergraduate degree in technical analysis and my Master’s degree in fundamental analysis in the FX market.
Since then, I have been following markets daily, created various trading strategies, backtested them, and chose the ones that work best for me.
Alright, now it’s time to finally start the educational part.
What does it take to become a successful trader?
A successful trader is an analyst , trader , and (risk and psychology) manager – all at once.
The analyst side of a trader generates trading ideas, the trader side executes the trades, and the manager side manages both the risk and psychological aspects of trading.
We’ll go through each of them in this educational series.
Trading is not about following technicals all day long. Professional traders and large players in this market don’t buy EUR/USD (or any other pair) when a Moving Average crosses above or below another Moving Average, or when the RSI shows overbought or oversold levels.
Forget about trendlines and wedge patterns for a moment (how many times did you catch a fake breakout trading them?) and open your mind to a trading approach that combines:
Fundamentals
Intermarket analysis
Sentiment analysis
...and (the correct) technical tools
Those disciplines form the cornerstone of what I like to call the FIST analysis. We’ll use technicals only to enter into a trade after we already have a direction derived from the other types of analyses.
So, this educational series will start with your analyst side (FIST), continue with your trader side (process/strategy/execution), and finish with your manager side (managing risks, managing yourself, position-sizing, scaling in and out of positions, etc.).
By the end of the series, you’ll hopefully get a completely different picture of trading than you had before.
If you find this trading educational series useful, please follow and hit the “LIKE” button.
Have questions? Post them in the comment section below.
Coming Up: Why Technicals Alone Are Not Enough?

Different Type of Charts - Part 1Hi
in this tutorial video I am covering five types of charts;
1. Line
2. Bar
3. Traditional Candlestick
4. Colored candlestick
5. Renko

Orderzones Explained : A form of Support & ResistanceHello traders!
In this educational idea im going to be going over the 5 different main types of Order Zones on Crypto Charts & how i identify and draw these zones, aswell as what they are used for.
Orderzones are a way of marking on the chart historically significant areas where price had strong reactions to.
The price tends to come back to these areas and have strong reactions, the Order Zones act as a form of Support & Resistance.
For those who are new to Technical Analysis ; "Support" is a area on the chart price and demand (buying pressure) increases from, with "Resistance" being the opposite, with price decreasing and sell orders (Supply of asset) increasing from the latter.
Why do i use Order Zones?
-Reduces risk & increases probability of potential trades
-Trying to trade with; not against larger size traders such as institutions that use similar price levels due to historic signifcance
-Providing clear entry and exit points to calculate Risk:Reward Ratio (R:R)
-Providing reference points to capitalize on historical areas of market volatility
-Allows us to reduce clutter and find key areas as the volatility on Crypto makes it difficult to chart
We have 5 main types:
-Supply Clusters
-Demand Clusters
-Single Candle Supply
-Single Candle Demand
-Orderblocks
Supply Clusters & Demand Clusters
First we must find areas on the chart that look similar to a tightly squeezed together rectangle . Price should then make a "thrust" (major increase, or decrease in value) from this rectangular area. We use the Rectangle Tool to draw a zone across these areas.
In the below image you can click for a in depth explanation of how to use these clusters in your trades.
Single Candle Supply & Single Candle Demand
To draw and identify the Zones first we must find areas on the chart where a strong reversal occurs, at the start of the trend reversal, or at swing points we can find larger then normal "wicks": (wicks are the thin, needle points at the end of the candlesticks ) as you can see in the above and below images.)
Click the below image for a in depth explanation of how to use these zones in your trades.
Orderblocks
Orderblocks are the small square shaped candle bodies, usually found in between significant price moments. They are small "pauses" before the next move. We use the Rectangle Tool to draw a zone across these areas.
In the below image you can click for a in depth explanation of how to use Orderblocks in your trades.
If you take some time to go back over your charts (especially on the Monthly, Weekly & Daily timeframes) and test out some of these Order Zones, you will see more then often price comes back to these areas before reversing like a magnet towards the next closest Order Zone so they become a useful tool in any traders arsenal.
If you found the idea informative show your support by Liking & Commenting thank you!

An up and down channelWelcome Back.
Please support this idea with LIKE if you find it useful.
***
What Is an Ascending Channel?
An ascending channel is the price action contained between upward sloping parallel lines. Higher highs and higher lows characterize this price pattern. Technical analysts construct an ascending channel by drawing a lower trend line that connects the swing lows, and an upper channel line that joins the swing highs.
***
An ascending channel is used in technical analysis to show an uptrend in a security’s price.
It is formed from two positive sloping trend lines drawn above and below a price series depicting resistance and support levels, respectively.
Channels are used commonly in technical analysis to confirm trends and identify breakouts and reversals.
***
A bearish channel is a continuation chart pattern (of a trend). A bearish channel is formed by two parallel bearish lines. The price progresses between these two parallel lines; the upper line is called the "resistance line"; the lower line is called the "support line".
Each of these lines must have been touched at least twice to validate the pattern.
NB: a line is said to be "valid" if the price line touches the support or resistance at least 3 times.
This implies that the bearish channel pattern is considered valid if the price touches the support line at least 3 times and the resistance line twice (or the support line at least twice and the resistance line 3 times).

Dollar Index (DXY) From an educational point of view, time cycle theory shows that the price of the dollar in January is interested in reaching its lowest level.
In fundamental terms, the dollar usually weakens slightly towards the end of the presidency.
Especially if a Republican like Trump is president.
The value of the dollar weakens, especially during the Republican era, and grows during the Democratic era. (Just look at the chart)
There are two lines of support here that mark the end of the flat correction pattern.
Wave support line (4) and correction wave support line (a)
I estimate the probability of a price return from wave support (4) as 30%.
And I estimate the probability of a price return from wave (a) support at 80%.
I wish you good deals
Please like the post and leave a comment so that we can get energy and provide more analysis, thank you

Money Flow Index (MFI)MFI is a momentum indicator.
It measures the flow of money.
Money Flow Indicator incorporates volume. (Remember that RSI only consider the price)
You can change the preset values.
Oversold levels normally set to 20. ( Less than 20, there will be fewer signals and more than 20 you will get more false signals )
Overbought levels happen above 80. ( More than 80, there will be fewer signals and less than 80 you will get more false signals )
Divergences are also important which I will cover in another video.

How to use yearly pivotsYearly pivots are among my top favourite tools.
Nearly all the major reversals or rallies stop or turn at yearly pivots.
You can also use them as targets when you see price is heading or is close to yearly pivot. It will surely hit it.
You can observe it for yourself on this EURUSD chart.
When price is above yearly pivot target R1 if below target S1. Watch also Yearly Midpivots (they are also very important).
It is good to use long term moving averages along with yearly pivots to detect the long term trends.
To apply yearly pivots use - choose "pivot points standard" then choose yearly classic, set period to 2 last years, unclick R3 S3 as price rarely makes it those (unless it is a super volatile pair).
For mt4 you can download free indicator "yearly pivots".
Good Luck!

How to trade gaps (price inefficiencies)Gaps do exist in forex in the form of price inefficiencies - by Chris Lori definition, the original source and author. ICT, former Chris Lori student renamed them into "price imbalances".
Whatever you call them - thin runs, price voids, price imbalances, price inefficiencies, illiquid runs - they will get filled in most cases (if instrument is liquid enough such as GBPUSD, EURUSD, Gold etc) either to the point of release or to the clean breaking point (CBP) (Chris Lori definition, the original source (ICT renamed them into "ICT breakers"). Gap fills are also called "rebalancing of price".

Trading EURUSD after European Gold Pit OpenSimple and affective forex trading strategy explained for the EURUSD, when breaking opening range of the European Gold Pit Open. Combining an EMA cloud to help with Entry

WHY DID THE BULLISH CONTINUATION MOVE FAIL?What does "End of Month Square Up" mean.
A square position is a situation where a trader or portfolio has no market exposure. ... The reason for this confusion is that the term "squaring up" is used to describe settling open trades before the market closes.
A square position is also referred to as a "flat position."
Square position, like many trading terms, can take on a different nuance depending on the speaker. For an individual forex trader, a square position can refer to offsetting long and short positions in the same currency pair or a situation where a currency trader holds no positions in the market. The reason for this confusion is that the term "squaring up" is used to describe settling open trades before the market closes. Squaring usually refers to just a few positions, but a trader could close out all of his open positions and get out of the market.
The "Market Makers" can use this trading principle as they move the market.
E/U had a Bullish Trend which became a consolidated range.
Price had a Bearish Breakout of the Range bottom which failed.
Price created Higher Highs and Higher Low making it appear a Bullish Continuation move was happening.
This drew in long traders leaving behind lots of money tied up in Stop Losses.
The Market Makers can tell where the most money is tied up on the Long side or Short Side.
It seems to appear that the Market Makers made the Bullish Continuation Reversal fail and took out the Stop Losses at the Higher Low entry point and also the 50% reversal entry point.
All of this happening the last few days of the End of the Month of October.
Could this be an example of the "END OF MONTH SQUARE UP?"

Where would you enter?A channel is one of the most basic price action patterns
The channel is a powerful yet often overlooked chart pattern and combines several forms of technical analysis to provide traders with potential points for entering and exiting trades, as well as controlling risk. The first step is to learn how to identify channels. The next steps include determining where and when to enter a trade, where to place stop-loss orders, and where to take profits.
$$$$$$$
Trading channels can be drawn on charts to help see uptrends and downtrends in a stock, commodity, ETF , or forex pair.
Traders also use channels to identify potential buy and sell points, as well as set price targets and stop-loss points.
Ascending channels angle up during uptrends and descending channels slope downward in downtrends.
Other technical indicators, such as volume , can enhance the signals generated from trading channels.
How long the channel has lasted will help determine the trend's underlying strength.

Waiting to Enter on a Channel BreakHello my friend | Welcome Back.
Please support this idea with LIKE if you find it useful.
***
* Once I have this structure in place, finding the trend becomes relatively easy. When the pair is trending lower, I only want to look for selling opportunities. Of course, the opposite is true when the pair begins trending higher.
Enter in the Direction of the Trend
At this point, you have identified the major trend and found a favorable corrective pattern such as a channel or a wedge.
The next step is to look for an entry once price breaks the pattern.

Ascending Triangle Definition and TacticsHello my friend | Welcome Back.
Please support this idea with LIKE if you find it useful.
***
* The trendlines of a triangle need to run along at least two swing highs and two swing lows.
* Ascending triangles are considered a continuation pattern, as the price will typically breakout of the triangle in the price direction prevailing before the triangle. Although, this won't always occur. A breakout in any direction is noteworthy.
* A long trade is taken if the price breaks above the top of the pattern.
* A short trade is taken if the price breaks below the lower trendline.
* A stop loss is typically placed just outside the pattern on the opposite side from the breakout.
* A profit target is calculated by taking the height of the triangle, at its thickest point, and adding or subtracting that to/from the breakout point.
Thank you


Head and ShouldersHello my friend | Welcome Back.
Please support this idea with LIKE if you find it useful.
***
where would you enter? 🤔

EURUSD - ending diagonal educational postA channel forms when price action is controlled by 2 parallel, sloping lines ... Conservative traders may look for additional confirmation before entering a trade.
The main rules for an ending diagonal
This pattern subdivides into five waves.
Wave 2 never ends beyond the starting point of wave 1.
Wave 3 always breaks the ending point of wave 1.
Wave 4 usually breaks beyond the ending point of wave 1.
Wave 5 in the absolute majority of cases breaks the ending point of wave 3.
Wave 3 can't be the shortest.
Wave 2 can't be a triangle or a triple three structure.
Waves 1, 3 and 5 form like zigzags.
