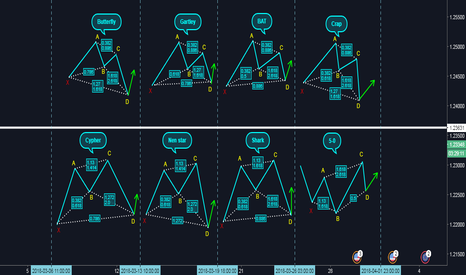
Gartley
Harmonic Patterns - Gartley - Approach 01- AB has to touch the 0.618 of XA, but cannot touch to the 0.786 of XA
- BC has to touch the 0.618 of AB, but cannot go above the A
There are a few ways to look for D. In this approach, it is:
- Put a Fib Retracement from X to B.
- Put a Trend-Based Fib Retracement from A to B to A
- If the 0.718 and 1.272 are close to each other choose, 0.718
- Else, choose the 1.272
Targets
- the 0.382 or the 0.618 of Fib Retracement from A to D.
Stop
- X or 10 pips below
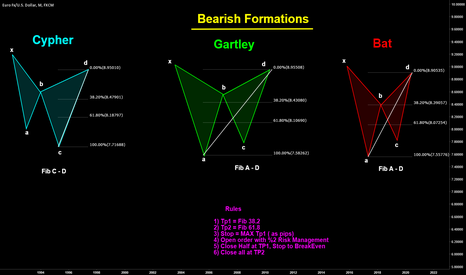
The GartleyThis is another common harmonic pattern which can be used to great effect. The gartley has the following ratios
AB: The AB move should be approximately 61.8% of the XA size. BC: The BC move should then reverse the AB move. At the same time, the BC move should finish either on the 38.2% Fibonacci level, or on the 88.6% Fibonacci level of the prior AB leg.
CD: The CD should be a reversal of the BC move. Then if BC is 38.2% of AB, then CD should respond to the 127.2% extension of BC. If BC is 88.6% of AB, then CD should be the 161.8% extension of BC.
AD move then takes a 78.6% retracement of the XA move.
Deep self-exploration of the individual unconscious turns into a process of experiential
adventure in the universe-at-large which involves cosmic consciousness.
Gartley Pattern: Explained In todays video I walk you though the Gartely pattern with all the levels you need to look out for if you want to start using them in your trading.
Happy to answer questions that might come up.
How To Trade The Gartley Pattern.Hi Traders,
Above Is an illustration of a complete Gartley Pattern and the rules and ratios needed to trade this pattern.
First things first, grab your Fibonacci tool and draw from the X to A leg of the initial move or impulse leg.
The Fibonacci ratio's you are looking for are the 0.618% and the 0.786%, price MUST at least touch or spike through the 0.618% but not touch or exceed the 0.786%.
The price reversal zone is shown in the white box.
Now you have the B leg we are looking for the C leg which is a retracement of the A to B move.
Once again grab your Fibonacci tool and draw from the A leg to the B leg, you are looking for a minimum of the 0.618% retracement.
On the C leg the price reversal zone is a little wider, price MUST hit the 0.618% but not exceed the A leg, which is once again shown in the illustration above.
Once you have the X A B and C legs you are looking for the final piece of the jigsaw which is the D leg completion and the area you are looking to buy.
there are a couple of different ways to get the D leg however they both end up at the same price, for me personally I use the Fibonacci retracement tool.
To get the D leg take your Fibonacci tool and draw from the B to A leg which will give you a 1.272%.
Once price falls to the 1.272% all criteria's are met, at which point you would buy in anticipation that price will rise.
TARGETS:
When looking to take targets on this pattern the first step is to once again use your Fibonacci tool.
Take your Fibonacci tool and draw from the C to D leg, you are looking for the 0.382% and 0.618%.
If this is the method you are looking to use for targets you would have your broker take off half of your position at the 0.382% and the other half at the 0.618%
To protect the profits you have accumulated it is advised to move stop loss to breakeven once the 0.382% target 1 has been attained, thus giving you a risk free trade and money in the bank.
STOP LOSS:
When looking to place your stops there are again many ways this can be done, but should always be placed below the X leg.
Your risk reward should be a minimum of 1:1 on every trade to the 0.382%, if this can not be achieved then I would not personally take the trade.
CURRENCY PAIR:
This pattern like any other and is more profitable with certain currency pairs, you should do your own back testing on this before trading the pattern.
I hope this is a more in-depth insight to advanced patterns in particular the Gartley Pattern.
I am available via private message for any questions you may have.
WEBSITE:
www.UKForexSignals.com
DISCLAIMER:
Please note I am only providing my own trading information for your benefit and insight to my trading techniques, you should do your own due diligence and not take this information as a trade signal.
3 TRADING STRATEGY'S IN ONE CHART - EXPLAINEDHi Traders,
Please find below three basic trading strategy's that can be implemented to any market on a daily basis.
I have only given out basic information on the ratio's and Fibonacci's of the three strategy's, should you need anymore in depth information don't hesitate to contact me.
2618 Rules Of Engagement:
1. Double top
2. Break & close below neckline / support
3. Sell at 0.618% Fibonacci Retracement
Gartley Pattern Rules Of Engagement:
1. 0.618 Retracement of the X to A leg
2. Atleast a 0.618 Retracement of A to B leg ( can't exceed A )
3. 1.272 Retracement of the B to A leg
4. Buy at the D leg ( 1.272 )
The ABCD Rules Of Engagement:
1. 0.618 Retracement of the A to B leg
2. 1.272 Retracement of the B to C leg
3. Buy at the D leg ( 1.272 )
gartley advanced formationGartley Advanced formation
Tools:
*Fibonacci retracements (61.8% and 78.6%)
*Fibonacci extension (127.2%)
Timeframes:
*The Gartley Advanced formation was originally designed as a swing trading strategy. But it also works on lower timeframes.
Tactics:
*Seek to identify 4 market moves and 3 major Fibonacci zones. The combination of these moves forms the points (X, A, B, C, D) that fulfill the formation.
Rules of engagement: Criteria 1
The Gartley Advanced formation starts with a market movement/impulse leg that establishes our X and A points.
Once X and A points have been identified, we then look for our first criteria.
Criteria 1: The market forms the B completion point by fulfilling at least a 61.8% retracement of the XA leg.
Note: AB move remains valid as long as there is at least a 61.8% retracement of XA and that it does not touch the 78.6% retracement of XA. Only candlewick is calculated here. Candle close is not important.
Rules of engagement: Criteria 2
If criteria 1 has been met, then look for criteria 2.
Criteria 2: The market forms the C completion point by fulfilling at least a 61.8% retracement of the AB.
Note: BC move remains valid as long as there is at least a 61.8% retracement of AB and that it does not touch the 88.6% retracement of AB. Only candlewick is calculated here. Candle close is not important.
Rules of engagement: Criteria 3
If criteria 1 and 2 have been met, then look for criteria 3.
Criteria 3: The market forms the D completion (entry point) by fulfilling a 127.2% extension of AB.
Note: D point never extends past X.
Trade management: Entry, stops & targets.
Entry: Limit order is placed at D completion point.
Target 1: 38.2% retracement of AD leg. When attained half of the position closes & stop moves to breakeven.
Target 2: 61.8% retracements of AD leg.
Stop placement: Stop always goes past X. Either 113% XA extension, or 1 ATR beyond X, or 1 to 1 measured distance to the first target.
5 EASY STEPS TO TRADE THE GARTLEY PATTERNSTAGE 1:
THE BULLISH IMPULSE LEG
A bullish impulse leg is a strong move in price action to the upside.
The impulse leg can be a mixture of bullish and bearish candles, but must have a bullish overall direction.
The start of the impulse leg should be marked as X and the top of the impulse leg should be marked as A.
STAGE 2:
B LEG RETRACEMENT
Now that you have identified your X to A impulse leg you are now looking for the B leg, which is a retracement of the X to A impulse leg.
Take your Fibonacci retracement tool and draw from your X leg to your A leg.
The crucial Fibonacci levels you are looking for are the 61.80% and 78.60%
Price action must at least touch the 61.80% retracement but cannot touch the 78.60% retracement.
As you can see by the illustration, the candle does not need to close below the 61.80% retracement but must at least spike through.
The bullish Gartley pattern will be invalid if price action touches the 78.60% retracement of the X to A move.
STAGE 3:
C LEG RETRACEMENT
Once you have identified a valid X to A impulse leg and a B leg retracement, you are now looking for a valid C leg retracement.
Take your Fibonacci retracement tool and draw from your A leg to your B leg.
The crucial Fibonacci retracement level you are looking for is the 61.80%
Price action must at least touch the 61.80% but cannot spike above the A leg resistance.
The candle does not need to close above the 61.80% but must at least spike through.
The bullish Gartley pattern will be invalid if price action spiked above the A leg resistance.
STAGE 4:
D LEG COMPLETION
Now that you have a valid X, A, B and C move you are looking for the final leg in price action at which point you will buy the chosen currency pair.
Take your Fibonacci retracement tool and draw from your B leg to your A leg.
You are looking for a 1.272% which will now give you a valid D leg completion of the bullish Gartley pattern.
STAGE 5:
PLACING YOUR TARGETS
When looking to take targets on the bullish Gartley Pattern the first step is to use your Fibonacci retracement tool.
With your Fibonacci retracement tool draw from the A to D leg, you are looking for target 1 at the 38.20% and target 2 at the 61.80%.
To protect the profits you have accumulated at target 1 it is advised you move your stop loss to breakeven once the 38.20% target 1 has been attained, thus giving you a risk free trade to target 2.
KEY NOTES & RULES:
When trading the bullish Gartley pattern, the pattern is meant to be traded at 1.272% D leg completion only.
If you believe the pattern is unfolding but price is only at point B, be patient and wait until price reaches the D leg completion.
The power of the pattern comes from converging Fibonacci levels of all points from X to D.
Point B must at least touch the 61.80% retracement but cannot touch the 78.60% from the X to A move.
Point C must touch the 61.80% but cannot spike above the A leg resistance.
Point D is complete when price action touches the 1.272% retracement of the B to A move.
Stop loss must be placed below the X leg structure support.
Stop loss must also be a minimum of a 1:1 risk reward to the 38.20% target 1.
Target 1 at the 38.20% retracement of the A to D move.
Target 2 at the 61.80% retracement of the A to D move.
CURRENCY PAIR:
This pattern like any other is more profitable with certain currency pairs, you should do your own back testing on this prior to trading the pattern.
CANDLE COLOUR:
Blue = Bullish Candle
White = Bearish Candle
DISCLAIMER:
Please note I am only providing my own trading information and techniques for your benefit and insight, you should do your own due diligence and not take this information as a trade signal.
Educational 06: Gartley PatternIt is the second most important trading pattern in Harmonic Pattern series , called Gartley Pattern which is also frequently observed in markets. This post a second post of educational series related to Harmonic Patterns ,
In this post, I cover the following things regarding the pattern
1. Pattern Traits
2. Step by Step formation of the Pattern
3. Bullish Gartley Pattern measurements, labelling and targets
4. Bearish Gartley Pattern measurements, labelling and targets
5. Look of the pattern
Further to come in this Harmonic Pattern series , where I shall be discussing about the below patterns:
1. AB=CD Pattern (Completed) ----> Link below
2. Gartley Pattern (Present)
3. Cypher Pattern >>>>> Next
4. Bat Pattern (Coming up)
5. Butterfly Pattern (Coming up)
The best part of the above mentioned patterns that they can be used in all markets and at any time frame. It means you can use the patterns in stock markets, Forex , Commodities and at any time frame like hourly, daily, weekly etc. Therefore, they are important tools when analyzing the charts.
Purpose: To provide information to traders community that can help individual trader to learn more and take inform decisions while trading in order to generate consistent positive results.
Practice the above said chart pattern and share it below with us.
Thanks for the support,
Best Regards,
Neetesh Jain
Bullish and Bearish Gartley PatternFew Advice that how can you be Good Forex Trader.
1 > Making pips no big issue things is that how you manage it.
2 > Every day is not TP days so be Ready for SL too.
3> Trade for Leave not Leave for Trade/
4> No one can be Billionaire in a night
5> Never Greed
6> Never be over confident on your Trade.
7> Always use SL
8> If in any trade if get 50+ PIPS book it otherwise must move sl at cost
9> Try to learn as Forex Trading must b like Business not like Gambling
10> During big Event try to stay away from market for few moments and if trade must use Tight Sl
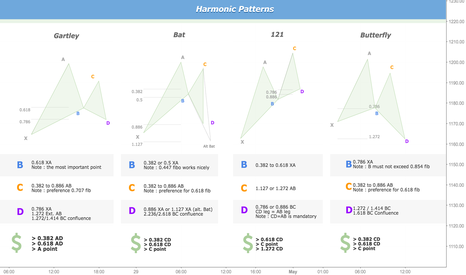
Harmonic Patterns ratio and examplesHi,
Above, some harmonic patterns that i often look for (bullish ones)
These patterns, when identified, have a good risk/reward ratio. They allow traders to enter into the market with minimal risk. Obviously, you need some other confirmations before taking the trade on the pattern completion.
If the point D occurs with some divergence on classic oscillators (RSI / Macd, Sto), on a bottom (or top, if pattern is bearish) of a trendline / channel, previous support/resistance levels, supply/demand zone...then there are good probabilities to see price react on the completion of the pattern.
There are plenty of patterns, but this selection, from my side, is a good start for those who want to learn harmonic pattern.
Below some examples that have worked nicely (this don't work each time, this would be too easy ;)


