Mastering Liquidity Dynamics: Understand the Dynamic True ValueDear Reader,
Thank you for reading—your time is valuable.
Use the chart's zoom-in/out (-/+) function for better visibility. This chart captures a large sample for your evaluation.
Below is the manual detailing the Smart Farmer System —a Dynamic True Value framework derived from real-time data to anticipate market intent and liquidity behavior .
If this resonates with you, drop a comment below— constructive insights are always welcome .
The Dynamic True Value - a Smart Farmer System: Terminology and Mechanics
: For now, I have firmed up POC - Price of Control, VAP - Value Average Pricing, SULB - Sell Upper Limit Bound, BLLB - Buy Lower Limit Bound.
Mechanic:
POC - Where fair value price dynamic is read.
VAP - Trading above indicates bullish sentiment of the cycle, and the opposite for bearish sentiment.
A crossed over of:
Grey POC above Green VAP - Signaling distribution, accumulation, consolidation, build-ups, correction, retracement .
Green VAP above Grey POC - Bullish strength and momentum consistency .
Pink VAP above Black POC - Bearish strength and momentum consistency .
Flip of Pink VAP to Green VAP - Sentiment flips from bear to bull, and the same goes for green flip to pink showing bull to bear.
Validation of entry signals requires:
Signal's candle must close past the opposite side of POC – flip sentiment .
The confirmation candle (is the closed next candle immediately after entry signal candle) must continue closed past the POC – maintain sentiment .
The progress candle (is the next candle closed right after the Confirmation Candle) shows traction, momentum build-up, and volume consistency .
Hint of invalidation:
Signal's candle is considered void if the next candle prints a new entry signal in the opposite direction. This often signals accumulation, sideways movement, build-up, uncertainty, or swings in range .
The immediate next candle closed past POC to the opposite side.
What to understand about Liquidity Trap, SULB, and BLLB:
Liquidity traps
Often occur at the recent/previous flatlines of Dynamic True Value (POC, VAP, SULB, BLLB) .
It is worth paying attention to the market’s intent and institutional positioning.
Signs of exhaustion, absorption, inducement, offloading, and accumulation are visible in the M1 (one-minute) TF, with significant confluence near the previous/recent flatlines of Dynamic True Value in the higher/macro-TFs.
An Anchored VWAP tool can be helpful for filtering noise in the market. This tool can be found in the drawing tab in the TradingView platform.
SULB
Details the dynamic of upper resistance where Bears remain in control below the dynamic level.
Below this limit bound (LB) , bears show strength – bear sentiment .
A converging price toward this LB indicates bulls are present.
Moving past this LB (a candle closed above) and successfully RETESTING newly formed support indicates a confirmed directional shift . Followed by printing a new BLLB in the next following candles with price continuing to rise above this failed SULB.
A rejection below LB (a rejection/exhausted candle closed below LB) and successful RETEST reaffirms the resistance holds , indicating downside continuation .
BLLB
Details the dynamic of lower support where Bulls remain in control above the dynamic level.
Above this LB, bulls show strength – bull sentiment .
A converging price toward this LB signifies bears are present.
Moving past this LB (a candle closed below) and successfully RETESTING newly formed resistance indicates a confirmed directional shift . Followed by printing a new SULB in the next following candles with price continuing to push lower below this failed BLLB.
A rejection above LB (a rejection/exhausted candle closed above LB) and successful RETEST reaffirms the support holds , indicating upward continuation .
Important Notes:
Select preferred Entry’s Signal TF (ex. M3 TF, M5 TF for scalping strategy, M15 for intraday/daily strategy, 4H TF for day-to-weekly strategy, etc.).
Always refer to the selected Entry’s TF for trading progress. Anticipate TP and SL by watching the range in this TF.
Non-entry TFs are not for entry purposes. These multi-TFs are used for measuring strength, momentum, liquidity, positioning, structure – The market intends . The Non-entry TF is used to anticipate institutional executions and liquidity pools.
These criteria MUST BE MET. A failed criterion suggests vague execution. Be patient and wait for clear validations.
Institutions excel in creating illusions.
SFS is designed to stand ready, calm, and execute with Clarity.
SFS cuts through noise, distraction, and stays independent of NEWS, GEOPOLITIC, RUMORS, and herd mentality because all these are designed to mislead retail traders into institutional traps.
When we see such ambiguity against the criteria, we know not to fall into the TRAP and become the liquidity FUEL.
Stay sharp, only respond when signals are firmed. SFS is designed to counter Smart Money capitalism. It is about time to level the playing field.
Liquidity

Follow the Flow: Trading with Liquidity ZonesLiquidity is where the market breathes. The Liquidity Zones indicator by BigBeluga helps traders visualize where large players may be hiding orders—revealing the zones where price is most likely to react, reverse, or accelerate.
Let’s break down how this tool works, how we use it at Xuantify, and how you can integrate it into your own strategy.
🔍 What Is the Liquidity Zones Indicator?
This open-source tool identifies pivot highs and lows filtered by volume strength and plots them as liquidity zones —highlighting areas where buy/sell orders are likely to accumulate.
Key Features:
Volume-filtered pivot detection (Low, Mid, High)
Dynamic or static liquidity zone boxes
Color intensity based on volume strength
Liquidity grab detection with visual cues
These zones act as magnets for price , helping traders anticipate where reactions, reversals, or stop hunts may occur.
🧠 How We Use It at Xuantify
We use Liquidity Zones as a contextual map for structure and execution.
1. Entry & Exit Planning
We align entries near untested liquidity zones and use them as targets for exits—especially when confirmed by structure or momentum.
2. Liquidity Grab Detection
When price pierces a zone and reverses, it often signals a liquidity sweep . We use this as a trigger for reversal setups.
3. Volume Context
Zones with higher volume intensity are prioritized. These are more likely to attract institutional activity and generate stronger reactions.
🧭 Dynamic vs. Static Zones
The indicator offers both dynamic and static zone modes:
Dynamic : Box height adjusts based on normalized volume, showing how much liquidity is likely present.
Static : Consistent box size for cleaner visuals and easier backtesting.
Why this matters:
Dynamic zones reflect real-time volume strength
Static zones offer simplicity and clarity
Both modes help visualize where price is likely to “grab” liquidity
⚙️ Settings That Matter
To get the most out of this tool, we recommend:
Volume Strength = Mid or High for cleaner zones
Enable Dynamic Mode when trading volatile assets
Use Color Intensity to quickly spot high-liquidity areas
🔗 Best Combinations with This Indicator
We pair Liquidity Zones with:
Market Structure Tools – BOS/CHOCH for context
Momentum Indicators – Like RSI or MACD for confirmation
Fair Value Gaps (FVGs) – For precision entries near liquidity
This layered approach helps us trade into liquidity , not against it.
⚠️ What to Watch Out For
Liquidity zones are not signals —they’re context . In fast-moving or low-volume markets, price may ignore zones or overshoot them. Always combine with structure and confirmation.
🔁 Repainting Behavior
The Liquidity Zones indicator is designed to be non-repainting . However, due to waiting for pivot confirmation, the zones are plotted in hindsight. This makes it suitable for real-time execution .
⏳ Lagging or Leading?
This tool is partially lagging —it waits for pivot confirmation and volume validation before plotting a zone. However, once plotted, these zones often act as leading levels , helping traders anticipate where price may react next.
🚀 Final Thoughts
The Liquidity Zones indicator by BigBeluga is a powerful visual tool for traders who want to understand where the market is likely to move—not just where it’s been. Whether you’re trading reversals, breakouts, or mean reversion, this tool helps you stay aligned with the market’s hidden intent.
Add it to your chart, test it, and see how it sharpens your edge.

Understanding Liquidity: Where Big Players Hunt Stops
Understanding Liquidity: Where Big Players Hunt Stops
Ever wondered why price suddenly spikes through your stop-loss and reverses moments later? That’s not a coincidence—it’s liquidity at play. This article will teach you how liquidity zones work, why stop hunts happen, and how to avoid getting trapped like the crowd.
🔵 What Is Liquidity in Trading?
Liquidity refers to how easily an asset can be bought or sold without drastically affecting its price. But in practical trading, liquidity is more than just volume—it’s where traders *place* their money.
Large players—institutions, market makers, or big accounts—need liquidity to fill orders.
They target areas where many retail stop-losses or pending orders are stacked.
These areas are often just above resistance or below support—classic stop-loss zones.
To move large positions without slippage, smart money uses stop hunts to trigger retail orders and create the liquidity they need.
🔵 Where Do Liquidity Zones Form?
Liquidity often builds up in predictable areas:
Above resistance: Where shorts place stop-losses.
Below support: Where longs place stop-losses.
Swing highs/lows: Obvious turning points everyone sees.
Round numbers: e.g., 1000, 10,000, 50,000.
Breakout zones: Where breakout traders place entries or stops.
These zones act like magnets. When price approaches them, it accelerates—seeking the liquidity pool behind the level.
🔵 What Is a Stop Hunt?
A stop hunt happens when price moves just far enough to trigger stop-losses before reversing. This isn’t market noise—it’s an intentional move by big players to:
Trigger a flood of stop orders (buy or sell).
Fill their own large positions using that liquidity.
Reverse price back to fair value or the prior trend.
Example: Price breaks above resistance → stops get hit → institutions sell into that liquidity → price drops sharply.
🔵 Signs You’re in a Liquidity Grab
Look for these clues:
Fast spike beyond key levels followed by rejection.
Wick-heavy candles near highs/lows.
Price touches a level, then sharply reverses.
High volume on failed breakouts or fakeouts.
These are signs of a liquidity event—not a real breakout.
🔵 How to Trade Around Liquidity Zones
You can use liquidity traps to your advantage instead of becoming their victim.
Avoid obvious stops: Don’t place stops directly below support or above resistance. Instead, use ATR-based or structure-based stops.
Wait for confirmation: Don’t chase breakouts. Let price break, reject, then re-enter inside the range.
Watch for wick rejections: If price quickly returns after a level is breached, it's often a trap.
Use higher timeframe confluence: Liquidity grabs are more powerful when they align with HTF reversals or zones.
🔵 Real Example: Liquidity Sweep Before Reversal
In this chart, we see a textbook liquidity grab:
Price breaks below support.
Longs get stopped out.
Candle prints a long wick.
Market reverses into an uptrend.
This is where smart traders enter— after the trap is set, not during.
🔵 Final Thoughts
Liquidity is the invisible hand of the market. Stop hunts aren’t personal—they’re structural. Big players simply go where the orders are. As retail traders, the best thing we can do is:
Understand where traps are set.
Avoid being part of the crowd.
Trade the reaction, not the initial breakout.
By thinking like the smart money, you can stop getting hunted—and start hunting for better trades.

How to Trade Liquidity Sweeps Using PDH/PDL Levels (Smart Money This guide shows how to use the **Liquidity Sweep Detector – PDH/PDL Levels** script, now live on my profile.
**What It Does:**
- Accurately plots the previous day's high and low on intraday charts (15m, 1H)
- Detects when price *sweeps* above or below those levels (potential liquidity grabs)
- Visually marks sweeps with a dashed line and alerts you in real time
- Optional table to show current sweep status (can be toggled off)
**How I Use It:**
- Wait for a sweep above PDH or below PDL
- Look for rejection candles or structure shift afterward (e.g., CHoCH or BOS)
- Combine with session timing (e.g., London/NY) for confluence
**Pro Tip:**
Set alerts to catch sweeps even when you're away from the screen. Just click "Add Alert" and use:
- `PDH Sweep Triggered`
- `PDL Sweep Triggered`
This is part of how I approach Smart Money trading — combining market structure with real liquidity events.
Script is open and free to use — find it on my profile:
**Liquidity Sweep Detector – PDH/PDL Levels**

Ultimate Guide to Liquidity Sweeps: Trading Smart Money MovesIn the world of Crypto and other financial markets, liquidity sweeps are deliberate price moves designed to capture liquidity sitting above or below key price levels. These moves are not random, they are orchestrated by large players who need to fill significant orders efficiently. By pushing price into zones where stop-losses and pending orders accumulate, these entities access the liquidity required to open large positions without causing excessive slippage.
Liquidity sweeps offer sharp insights into market structure and intent. Understanding how they work and recognizing them in real-time can significantly enhance a trader’s edge, especially in environments dominated by algorithmic and smart money behavior.
Defining the Liquidity Sweep
A liquidity sweep is characterized by a quick push through a well-defined support or resistance level, typically a recent high or low, followed by a swift reversal. These zones are hotspots for stop orders placed by retail traders, such as long stop-losses placed under swing lows or short stops above recent highs. When these stops are triggered, they act as liquidity pools.
Large players anticipate these zones and use them to enter positions. The sweep creates an illusion of breakout or breakdown, luring reactive traders in, only for the price to reverse direction once the necessary liquidity is absorbed. This mechanism reveals the strategic manipulation often present in efficient markets.
Structure and Behavior of a Sweep
The process typically starts with the market forming a recognizable range, often between a defined high and low. Price then consolidates or slowly trends toward one edge of the range, building tension. As the market reaches that boundary, a sudden surge beyond the level occurs, this is the sweep. Importantly, price does not sustain above or below the level. Instead, it quickly retraces, printing a rejection wick or reversal pattern.
Following the reversal, the market often resumes its original trend or begins a new leg in the opposite direction of the sweep. For traders, this offers a clear point of entry and invalidation, allowing for precise trade setups.
Bullish Scenario, Sweep of Lows
When Bitcoin approaches a prior low, especially one that marked a swing point or a support level, many traders place their stop-losses just below that low. This creates a pocket of sell-side liquidity.
In a bullish liquidity sweep, price will spike below this prior low, often triggered by a news event, a large market order, or a sudden increase in volatility. The market will quickly wick below the level, triggering stop-losses and perhaps inviting new short positions. However, instead of continuing lower, price snaps back above the broken level and begins to climb.
This reversal indicates that large players were absorbing liquidity at the lows and are now positioned long. Traders can look for bullish confirmation via engulfing candles, reclaim of the low, or a fast return into the previous range.
Bearish Scenario, Sweep of Highs
Conversely, when Bitcoin grinds higher toward a prior swing high or resistance level, traders anticipating a breakout may enter early, while others have stop-losses on short positions resting above the level.
A bearish liquidity sweep occurs when price spikes above the prior high, triggering those buy stops and breakout entries. Almost immediately, the market reverses, showing rejection at the highs. This action signals that buy-side liquidity has been used by larger players to enter short positions.
Once price fails to hold above the breakout level and begins to drop, the sweep is confirmed. Traders aligned with this read may look for bearish structure to form, such as a lower high, and enter short with a defined invalidation above the sweep.
Common Pitfalls and Misinterpretations
One of the most frequent mistakes traders make is confusing a sweep for a breakout. Liquidity sweeps are often mistaken for the beginning of a new trend leg, leading to premature entries that quickly get reversed.
Another pitfall is ignoring the broader market context. Liquidity sweeps are most reliable when they occur at logical levels aligned with higher time frame bias. Without that alignment, the sweep may simply be part of a choppy, indecisive range.
Lack of confirmation is also an issue. Entering trades immediately after a wick without seeing structure reclaim, volume shift, or candle confirmation can lead to unnecessary losses.
Confirming a Valid Sweep
To increase confidence in a sweep setup, traders should watch for several confirming behaviors. Volume often spikes during the sweep itself, followed by a drop in volatility as the market reverses. Divergences on momentum indicators like RSI or OBV can also support the idea of an exhausted move.
Most importantly, the reaction after the sweep matters more than the sweep itself. If price fails to reclaim the swept level or continues trending, the move was likely a true breakout, not a manipulation.
In high-probability sweeps, price often reclaims the level and begins forming structure in the opposite direction. Watching for breaker blocks, fair value gaps, or inefficiencies being respected in this phase can also strengthen the case for entry.
Conclusion
Liquidity sweeps are one of the clearest footprints left behind by smart money. While they can be deceptive in the moment, with enough practice and context awareness, they become one of the most powerful tools in a trader’s arsenal.
The key lies in understanding that these moves are engineered, not accidental. Recognizing where the market is likely hunting liquidity, and how it behaves after collecting it, can dramatically improve your ability to enter trades with precision, confidence, and clear invalidation.
__________________________________________
Thanks for your support!
If you found this guide helpful or learned something new, drop a like 👍 and leave a comment, I’d love to hear your thoughts! 🚀
Make sure to follow me for more price action insights, free indicators, and trading strategies. Let’s grow and trade smarter together! 📈

Mastering Volatile Markets: Liquidity Makes or Breaks Trades█ Mastering Volatile Markets Part 2: Why Liquidity Makes or Breaks Your Trades
If you've read the first part of this four-part series, you know that reducing position size is a key strategy for surviving volatile markets. The second crucial factor that determines success or failure in wild markets is understanding liquidity.
In volatile markets, liquidity is often the real reason behind those massive price spikes — whether 300-500 point moves in the NAS100, violent whipsaws in crypto or stop hunts in forex.
█ Liquidity: The Silent Killer in Wild Markets
In normal market conditions, liquidity is everywhere. You can enter and exit trades with minimal slippage, and everything feels smooth. But in volatile conditions, liquidity can disappear quickly.
Here's why it happens:
Market makers pull back to avoid getting caught in wild moves.
Spreads widen , making execution harder.
Order books thin out , meaning there aren't enough buy or sell orders to absorb aggressive price movements.
Even small orders can cause significant price changes when liquidity is low.
This is what causes those huge candles you often see in volatile markets. It's not just about more buyers or sellers; it's about less liquidity available to absorb those trades.
There’s also a common misunderstanding at play here: High Volume = High Liquidity
Many newer traders see a big volume candle and think, "Oh, high volume means it's safe to trade." But that’s an inaccurate conclusion.
⚪ Volume refers to the number of transactions happening.
⚪ Liquidity refers to how much depth the market has to handle those transactions without causing price instability.
In volatile markets, high volume doesn't mean there's enough liquidity.
And low liquidity causes wild wicks, huge spreads, higher slippage and unstable price action.
█ How to Navigate Low Liquidity in Volatile Markets
So, how can you trade effectively in these conditions?
1) Expect Crazy Moves — Levels Will Get Violated
In high-volatility, low-liquidity markets:
Support and resistance levels won't hold as they usually do.
Price will blow through key levels like they were nothing.
Fakeouts become extremely common.
2) Don't Rely Solely on Support & Resistance
As a newer trader, it's vital not to blindly rely on S/R levels in these markets. Here's why:
Don't expect clean bounces or perfect reactions.
Fakeouts, wicks, and stop hunts are normal.
Tight stops right behind these levels? You'll get stopped out a lot.
Experienced traders know this, which is why we adapt the strategies to handle the market's unpredictability.
3) Split Your Orders Into Smaller Chunks
One of the most effective techniques in volatile markets is order splitting.
Break it into smaller chunks instead of entering your full position at one price. This would help you survive fakeouts, scale in better across larger price moves and avoid becoming liquidity for bigger players.
Example: Let's say you want to go long at support (15,000 on the NAS100), instead of entering all at 15,000. Instead Enter:
25% at 15,000
25% at 14,950
25% at 14,900
25% at 14,850
This way, if the market fakes out below support due to low liquidity, you get filled at better prices without panic.
4) Control Your Emotions — Understand the Environment
This is HUGE in volatile markets.
Many retail traders panic when prices move against them quickly. But if you understand the nature of low liquidity , you can remain calm:
It's normal for the price to move wildly.
Levels will get swept.
Fake moves are common before the market plays out the right way.
█ Summary
Let’s take stock of what we learned today about liquidity in highly volatile markets:
High volatility often equals low liquidity.
High volume does not equal high liquidity.
Expect fakeouts , wild price behavior, and wide spreads.
Don't rely blindly on support/resistance levels.
Split your orders into smaller chunks to manage risk.
Trade smaller position sizes and stay calm.
Remember, you must adapt not only your size but also your execution . Understand liquidity, or it will punish you.
█ What We Covered Already:
Part 1: Reduce Position Size
Part 2: Liquidity Makes or Breaks Trades
█ What's Coming Next in the Series:
Part 3: Patience Over FOMO
Part 4: Trend Is Your Best Friend
-----------------
Disclaimer
The content provided in my scripts, indicators, ideas, algorithms, and systems is for educational and informational purposes only. It does not constitute financial advice, investment recommendations, or a solicitation to buy or sell any financial instruments. I will not accept liability for any loss or damage, including without limitation any loss of profit, which may arise directly or indirectly from the use of or reliance on such information.
All investments involve risk, and the past performance of a security, industry, sector, market, financial product, trading strategy, backtest, or individual's trading does not guarantee future results or returns. Investors are fully responsible for any investment decisions they make. Such decisions should be based solely on an evaluation of their financial circumstances, investment objectives, risk tolerance, and liquidity needs.

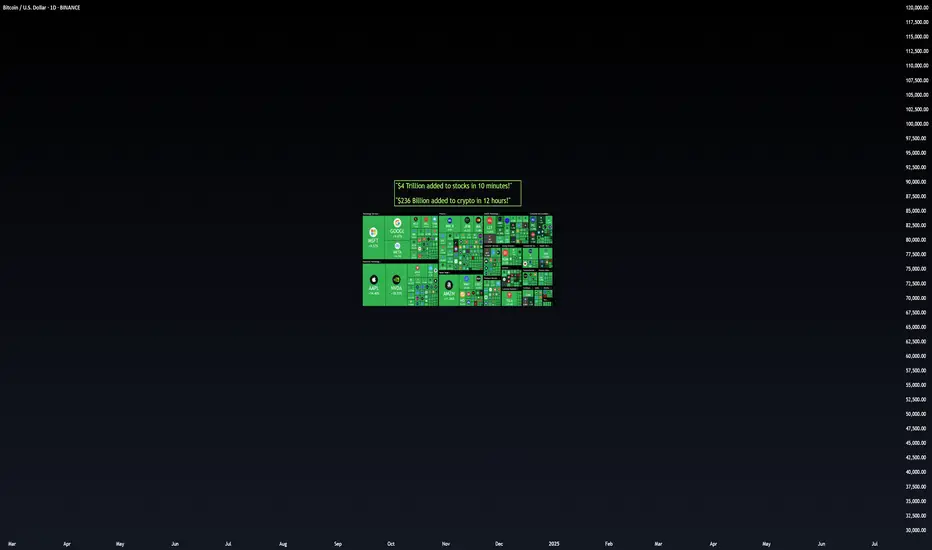
Market Cap Is Not Real Money InflowThe Market Cap Illusion — The Most Dangerous Misunderstanding in Finance Right Now
⚪ Let's talk about what nobody else wants to tell you.
Everywhere you look right now on social media, you're seeing the same recycled headline:
"$4 Trillion added to stocks in 10 minutes!" "$236 Billion added to crypto in 12 hours!"
Sounds exciting, right?
It’s also deeply misleading.
⚪ Here’s The Harsh Truth:
A rising market cap does NOT mean that billions or trillions of new money just magically flowed into the market.
It means prices went up. That’s it.
Market Cap = Last Traded Price x Total Supply/Shares
If Bitcoin moves up 8% → The entire Bitcoin market cap increases 8%. Even if only a small percentage of Bitcoin actually traded hands.
This is not "fresh capital inflow." It’s just higher prices multiplying across existing supply.
⚪ Let’s Be Super Clear:
WRONG:
"$236 Billion flowed into the crypto market." "$4 Trillion entered the stock market."
RIGHT:
"Market cap increased by $236 Billion because prices went up." "Stock market cap increased by $4 Trillion due to price movement — not because new money entered."
Big difference. Please stop confusing these.
⚪ So Why Does This Misunderstanding Exist?
Simple.
Most social media traders out there have consistently FAILED to educate their audience properly.
They focus on hype, engagement, and surface-level headlines because that’s what generates likes, not truth.
But here’s the problem:
This misinformation leads to false confidence. It leads to poor decision making. And worst of all — it misleads new traders into thinking markets work in ways they absolutely don’t.
⚪ It’s Time To Be Real.
Stop blindly trusting everything you see on social media. Stop believing every influencer who screams "money is flowing in!!"
Most of them don’t even understand what they’re talking about.
Real traders, real investors — they ask questions. They double check the facts. They understand the mechanics behind market moves.
And so should you.
⚪ The Real Difference:
Market Cap shows valuation based on price
Liquidity shows real money inflow based on actual capital entering
If you want to survive and thrive in these markets, start separating hype from reality.
Be smarter. Be curious. Be aware.
Disclaimer: This information is for entertainment purposes only and does not constitute financial advice. Please consult with a qualified financial advisor before making any investment decisions.
What Are the Inner Circle Trading Concepts? What Are the Inner Circle Trading Concepts?
Inner Circle Trading (ICT) offers a sophisticated lens through which traders can view and interpret market movements, providing traders with insights that go beyond conventional technical analysis. This article explores key ICT concepts, aiming to equip traders with a thorough understanding of how these insights can be applied to enhance their trading decisions.
Introduction to the Inner Circle Trading Methodology
Inner Circle Trading (ICT) methodology is a sophisticated approach to financial markets that zeroes in on the behaviours of large institutional traders. Unlike conventional trading methods, ICT is not merely about recognising patterns in price movements but involves understanding the intentions behind those movements. It is part of the broader Smart Money Concept (SMC), which analyses how major players influence the market.
Key Inner Circle Trading Concepts
Within the ICT methodology, there are many concepts to learn. Below, we’ve explained the most fundamental ideas central to ICT trading.
Structure
Understanding the structure of a market is fundamental to effectively employing the ICT methodology. In the context of ICT, market structure is defined by the identification of trends through specific patterns of highs and lows.
Market Structure
A market trend is typically characterised by a series of higher highs and higher lows in an uptrend, or lower highs and lower lows in a downtrend. This sequential pattern provides a visual representation of market sentiment and momentum.
Importantly, market trends are fractal, replicating similar patterns at different scales or timeframes. For example, what appears as a bearish trend on a short timeframe might merely be a corrective phase within a larger bullish trend. By understanding this fractal nature, traders can better align their strategies with the prevailing trend at different trading intervals.
Break of Structure (BOS)
A Break of Structure occurs when there is a clear deviation from these established patterns of highs and lows. In an uptrend, a BOS is signalled by prices exceeding a previous high without falling below the most recent higher low, confirming the strength and continuation of the uptrend.
Conversely, in a downtrend, a BOS is indicated when prices drop below a previous low without breaching the prior lower high, signifying that the downtrend remains strong. Identifying a BOS gives traders valuable clues about the continuation of the current market direction.
Change of Character (CHoCH)
The Change of Character in a market happens when there is a noticeable alteration in the behaviour of price movements, suggesting a potential reversal of a given trend. This might be seen in an uptrend where the price fails to reach a new high and then breaks below a recent higher low, indicating that the buying momentum is waning and a bearish reversal is possible.
Identifying a CHoCH helps traders recognise when the market momentum is shifting, which is critical for adjusting positions to capitalise on or protect against a new trend.
Market Structure Shift (MSS)
A Market Structure Shift is a significant change in the market that can disrupt the existing trend. This specific type of CHoCH is typically marked by a price moving sharply (a displacement) through a key structural level, such as a higher low in an uptrend or a lower high in a downtrend.
These shifts can signal a profound change in market dynamics, with the sharp move often preceding a new sustained trend. Recognising an MSS allows traders to reevaluate their current bias and adapt to a new trend, given its clear signal.
Order Blocks
Order blocks are a central component of ICT trading, providing crucial insights into potential areas where the price may react strongly due to significant buy or sell interests from large market participants.
Regular Order Blocks
A regular order block is an area on the price chart representing a concentration of buying (demand zone) or selling (supply zone) activity.
In an uptrend, a bullish order block is identified during a downward price movement and marks the last area of selling before a substantial upward price movement occurs. Conversely, a bearish order block forms in an uptrend where the last buying action appears before a significant downward price shift.
In the ICT trading strategy, order blocks are seen as reversal areas. So, if the price revisits a bullish order block following a BOS higher, it’s assumed that the block will hold and prompt a reversal that produces a new higher high.
Breaker Blocks
Breaker blocks play a crucial role in identifying trend reversals. They are typically formed when the price makes a BOS before reversing and breaking beyond an order block that should hold if the established market structure is to be maintained. This formation indicates that liquidity has been taken.
For instance, in an uptrend, if the price creates a new high but then reverses below the previous higher low, the bullish order block above the low becomes a breaker block. A breaker block can be an area that prompts a reversal as the new trend unfolds; it’s a similar concept to support becoming resistance and vice versa.
Mitigation Blocks
Mitigation blocks are similar to breaker blocks, except they occur after a failure swing, where the price attempts but fails to surpass a previous peak in an uptrend or a previous trough in a downtrend. This pattern indicates a loss of momentum and potential reversal as the price fails to sustain its previous direction.
For example, in an uptrend, if the price makes a lower high and then breaks the structure by dropping below the previous low, the order block formed at the previous low becomes a mitigation block. These blocks are critical for traders because they’re also expected to produce a reversal if a new trend has been set in motion.
Liquidity
Liquidity refers to areas on the price chart with a high concentration of trading activity, typically marked by stop orders from retail traders.
Buy- and Sell-Side Liquidity
Buy-side liquidity is found where there is a likely accumulation of short-selling traders' stop orders, typically above recent highs. Conversely, sell-side liquidity is located below recent lows, where bullish traders' stop orders accumulate. When prices touch these areas, activating stop orders can cause a reversal, presenting a potential level of support or resistance.
Liquidity Grabs
A liquidity grab occurs when the price quickly spikes into these high-density order areas, triggering stops and then reversing direction. In ICT theory, this action is often orchestrated by larger players aiming to capitalise on the flurry of orders to execute their large-volume trades with minimal slippage. It's a strategic move that temporarily shifts price momentum, usually just long enough to trigger the stops before the market direction reverses.
Inducement
An inducement is a specific type of liquidity grab that triggers stops and entices other traders to enter the market. It often appears as a peak or trough, typically into an area of liquidity, in a minor counter-trend within the larger market trend. Inducements are designed by smart money to create an illusion of a trend change, prompting an influx of retail trading in the wrong direction. Once the retail traders have committed, the price swiftly reverses, aligning back with the original major trend.
Trending Movements
In the Inner Circle Trading methodology, two specific types of sharp trending movements signal significant shifts in market dynamics: fair value gaps and displacements.
Fair Value Gaps
A fair value gap (FVG) occurs when there is a noticeable absence of trading within a price range, typically represented by a swift and substantial price move without retracement. This gap often forms between the wicks of two adjacent candles where no trading has occurred, signifying a strong directional push.
Fair value gaps are important because they indicate areas on the chart where the price may return to "fill" the gap, usually before meeting an order block, offering potential trading opportunities as the market seeks to establish equilibrium.
Displacements
Displacements, also known as liquidity voids, are characterised by sudden, forceful price movements occurring between two chart levels and lacking the typical gradual trading activity observed in between. They are essentially amplified and more substantial versions of fair value gaps, often spanning multiple candles and FVGs, signalling a heightened imbalance between buy and sell orders.
Other Components
Beyond these ICT concepts, there are a few other niche components.
Kill Zones
Kill Zones refer to specific timeframes during the trading day when market activity significantly increases due to the opening or closing of major financial centres. These periods are crucial for traders as they often set the tone for price movements based on the increased volume and volatility:
Optimal Trade Entry
An optimal trade entry (OTE) is a type of Inner Circle trading strategy, found using Fibonacci retracement levels. After an inducement that prompts a displacement (leaving behind an FVG), traders use the Fibonacci retracement tool to pinpoint entry areas.
The first point is set at the major high or low that prompts the displacement, while the second point is set at the next significant swing high or low that forms. In a bearish movement, for example, the initial point is set at the swing high before the displacement and the subsequent point at the new swing low. Traders often look to the 61.8% to 78.6% retracement level for entries.
Balanced Price Range
A balanced price range is observed when two opposing displacements create FVGs in a short timeframe, indicating a broad zone of price consolidation. During this period, prices typically test both extremes, attempting to fill the gaps. This scenario offers traders potential zones for trend reversals as the price seeks to establish a new equilibrium, as well as key levels to watch for a breakout.
The Bottom Line
Understanding ICT concepts gives traders the tools to decode complex market signals and align their strategies with the influential trends shaped by the largest market participants. For those looking to apply these sophisticated trading techniques practically, opening an FXOpen account can be a great step towards engaging with the markets through a robust platform designed to support advanced trading strategies.
FAQs
What Are ICT Concepts in Trading?
ICT (Inner Circle Trading) concepts encompass a series of advanced trading principles that focus on replicating the strategies of large institutional players. These concepts include liquidity zones, order blocks, market structure shifts, and optimal trade entries, all aimed at understanding and anticipating significant market movements.
What Is ICT in Trading?
ICT in trading refers to the Inner Circle Trading methodology, a strategy developed to align smaller traders’ actions with those of more influential market participants. It utilises specific market phenomena, such as order blocks and liquidity patterns, to analyse price movements and improve trading outcomes.
What Is ICT Trading?
ICT trading is the application of concepts that seek to identify patterns and structures that indicate potential price changes driven by institutional activities, aiming to capitalise on these movements.
What Is ICT Strategy?
An ICT strategy combines market analysis techniques to identify where significant market players are likely to influence prices. This includes analysing price levels where large volumes of buy or sell orders are anticipated to occur and identifying key times when market moves are most likely.
Is ICT Better Than SMC?
Comparing ICT and SMC (Smart Money Concept) is challenging as ICT is essentially a subset of SMC. While SMC provides a broader overview of how institutional money influences the markets, ICT offers more specific techniques and terms like inducements and displacements. Whether one is better depends on the trader’s specific needs and alignment with these methodologies’ intricacies.
This article represents the opinion of the Companies operating under the FXOpen brand only. It is not to be construed as an offer, solicitation, or recommendation with respect to products and services provided by the Companies operating under the FXOpen brand, nor is it to be considered financial advice.

What Is a Liquidity Sweep and How Can You Use It in Trading?What Is a Liquidity Sweep and How Can You Use It in Trading?
Mastering key concepts such as liquidity is crucial for optimising trading strategies. This article explores the concept of a liquidity sweep, a pivotal phenomenon within trading that involves large-scale players impacting price movements by triggering clustered pending orders, and how traders can leverage them for deeper trading insights.
Understanding Liquidity in Trading
In trading, liquidity refers to the ability to buy or sell assets quickly without causing significant price changes. This concept is essential as it determines the ease with which transactions can be completed. High liquidity means that there are sufficient buyers and sellers at any given time, which results in tighter spreads between the bid and ask prices and more efficient trading.
Liquidity is often visualised as the market's bloodstream, vital for its smooth and efficient operation. Financial assets rely on this seamless flow to ensure that trades can be executed rapidly and at particular prices. Various participants, including retail investors, institutions, and market makers, contribute to this ecosystem by providing the necessary volume of trades.
Liquidity is also dynamic and influenced by factors such as notable news and economic events, which can all affect how quickly assets can be bought or sold. For traders, understanding liquidity is crucial because it affects trading strategies, particularly in terms of entry and exit points in the markets.
What Is a Liquidity Sweep?
A liquidity sweep in trading is a phenomenon within the Smart Money Concept (SMC) framework that occurs when significant market players execute large-volume trades to trigger the activation of a cluster of pending buy or sell orders at certain price levels, enabling them to enter a large position with minimal slippage. This action typically results in rapid price movements and targets what are known as liquidity zones.
Understanding Liquidity Zones
Liquidity zones are specific areas on a trading chart where there is a high concentration of orders, including stop losses and pending orders. These zones are pivotal because they represent the levels at which substantial buying or selling interest is anticipated once activated. When the price reaches these zones, the accumulated orders are executed, which can cause sudden and sharp price movements.
How Liquidity Sweeps Function
The process begins when market participants, especially institutional traders or large-scale speculators, identify these zones. By pushing the market to these levels, they trigger other orders clustered in the zone. The activation of these orders adds to the initial momentum, often causing the price to move even more sharply in the intended direction. This strategy can be utilised to enter a position favourably or to exit one by pushing the price to a level where a reversal is likely.
Liquidity Sweep vs Liquidity Grab
Within the liquidity sweep process, it's crucial to distinguish between a sweep and a grab:
- Liquidity Sweep: This is typically a broader movement where the price action moves through a liquidity zone, activating a large volume of orders and thereby affecting a significant range of prices.
- Liquidity Grab: Often a more targeted and shorter-duration manoeuvre, this involves the price quickly hitting a specific level to trigger orders before reversing direction. This is typically used to 'grab' liquidity by activating stops or pending positions before the price continues to move in the same direction.
In short, a grab may just move slightly beyond a peak or low before reversing, while a sweep can see a sustained movement beyond these points prior to a reversal. There is a subtle difference, but the outcome—a reversal—is usually the same.
Spotting a Liquidity Sweep in the Market
Identifying a sweep involves recognising where liquidity builds up and monitoring how the price interacts with these zones. It typically accumulates at key levels where traders have placed significant numbers of stop-loss orders or pending buy and sell positions.
These areas include:
- Swing Highs and Swing Lows: These are peaks and troughs in the market where traders expect resistance or support, leading to the accumulation of orders.
- Support and Resistance Levels: Historical areas that have repeatedly influenced price movements are watched closely for potential liquidity buildup.
- Fibonacci Levels: Common tools in technical analysis; these levels often see a concentration of orders due to their popularity among traders.
The strategy for spotting a sweep involves observing when the price approaches and breaks through these levels. Traders look for a decisive move that extends beyond the identified zones and watch how the asset behaves as it enters adjacent points of interest, such as order blocks. The key is to monitor for a subsequent reversal or deceleration in price movement, which can signal that the sweep has occurred and the market is absorbing the liquidity.
This approach helps traders discern whether a significant movement is likely a result of a sweep, allowing them to make more informed decisions about entering or exiting positions based on the anticipated reversal or continuation of the price movement.
How to Use Liquidity Sweeps in Trading
Traders often leverage liquidity sweeps in forex as strategic indicators within a broader Smart Money Concept framework, particularly in conjunction with order blocks and fair value gaps. Understanding how these elements interact provides traders with a robust method for anticipating and reacting to potential price movements.
Understanding Order Blocks and Fair Value Gaps
Order blocks are essentially levels or areas where historical buying or selling was significant enough to impact an asset’s direction. These blocks can act as future points of interest where the price might react due to leftover or renewed interest from market participants.
Fair value gaps are areas on a chart that were quickly overlooked in previous movements. These gaps often attract price back to them, as the market seeks to 'fill' these areas by finding the fair value that was previously skipped.
Practical Application in Trading Strategies
Learn how liquidity sweeps can be applied to trading strategies.
Identifying the Trend Direction
The application of liquidity sweeps starts with understanding the current trend, which can be discerned through the market structure—the series of highs and lows that dictate the direction of the market movement.
Locating Liquidity Zones
Within the identified trend, traders pinpoint liquidity zones, which could be significant recent swing highs or lows or areas marked by repeated equal highs/lows or strong support/resistance levels.
Observing Order Blocks and Fair Value Gaps
After identifying a liquidity zone, traders then look for an order block beyond this zone. The presence of a fair value gap near the block enhances the likelihood of the block being reached, as these gaps are frequently filled.
Trade Execution
When the price moves into the order block, effectively sweeping liquidity, traders may place limit orders at the block with a stop loss just beyond it. This action is often based on the expectation that the order block will trigger a reversal.
Utilising Liquidity Sweeps for Entry Confidence
The occurrence of a sweep into an order block not only triggers the potential reversal but also provides traders with greater confidence in their position. This confidence stems from the understanding that the market's momentum needed to reach and react at the block has been supported by the liquidity sweep.
By combining these elements—trend analysis, liquidity zone identification, and strategic use of order blocks and fair-value gaps—traders can create a cohesive strategy that utilises sweeps to enhance decision-making and potentially improve trading results.
The Bottom Line
Understanding liquidity sweeps offers traders a critical lens through which to view market dynamics, revealing deeper insights into potential price movements. For those looking to apply these insights practically, opening an FXOpen account could be a valuable step towards engaging with the markets more effectively and leveraging professional-grade tools to navigate liquidity phenomena.
FAQs
What Is a Liquidity Sweep?
A liquidity sweep occurs when large market participants activate significant orders within liquidity zones, causing rapid price movements. It's a strategic manoeuvre to capitalise on accumulated buy or sell orders at specific price levels.
What Is a Sweep Trade?
A sweep trade is a large order executed through multiple different areas on a chart and venues to optimise execution. This is common in both equities and derivatives trading to minimise market impact.
How to Spot a Liquidity Sweep?
Liquidity sweeps can be identified by sudden, sharp movements towards areas dense with orders, such as previous swing highs or lows or known support and resistance levels, followed often by a rapid reversal.
What Is the Difference Between a Liquidity Sweep and a Liquidity Grab?
A liquidity sweep is a broader market move activating a large volume of orders across a range of prices. In contrast, a grab is a quick, targeted action to hit specific order levels before the price reverses direction.
This article represents the opinion of the Companies operating under the FXOpen brand only. It is not to be construed as an offer, solicitation, or recommendation with respect to products and services provided by the Companies operating under the FXOpen brand, nor is it to be considered financial advice.

Learn To Invest: Global Liquidity Index & BitcoinGlobal Liquidity Index & BitCoin:
🚀 Positive Vibes for Your Financial Journey! 🚀
BITSTAMP:BTCUSD
Look at this chart! It's the Global Liquidity Index , a measure of how much extra money is flowing through the world's financial systems.
Why is this important? Because when this index is high, it often means good things for investments like #Bitcoin! 📈
Think of it like this: when there's more money flowing, people are often more willing to take risks and invest in things like Bitcoin.
See those "BullRun" boxes? That means things are looking bright! It's showing that money is flowing, and that's often a good sign for potential Bitcoin growth. 🌟
Even if you're not a pro, it's easy to see the good news here. Understanding these trends can help you make smarter decisions.
Let's all aim for growth and success! 💪

2025 ICT Mentorship: Premium & Discount Price Delivery Intro2025 ICT Mentorship: Lecture 4_Premium & Discount Price Delivery Intro
Greetings Traders!
In this video, we dive into the fundamental concept of Premium and Discount Price Delivery—a crucial aspect of smart money trading that helps us understand how institutions approach the market with precision and efficiency.
Understanding Currency Pairs
Before we explore premium and discount dynamics, it's essential to grasp the basics of currency pairs. A currency pair, like EUR/USD or GBP/USD, represents the value of one currency against another. For example, EUR/USD shows how many U.S. dollars (the quote currency) are needed to purchase one euro (the base currency). Just like any other tradable asset, currency pairs fluctuate in value due to various economic and market factors.
Trading Is Part of Everyday Life
Believe it or not, everyone in the world is a trader. Whether you're buying groceries at a store or negotiating for goods and services, you're participating in trading activities daily. Some people aim to purchase items at a discount, while others can afford to pay a premium—it’s simply part of life.
However, banks and financial institutions take trading to another level. They don’t just trade haphazardly—they operate with extreme precision, aiming to make high-quality investments by executing trades at premium prices and targeting discount levels. This strategic approach allows them to capitalize on market inefficiencies and ensure profitable outcomes.
Why Premium and Discount Matter?
The concept of premium and discount price delivery is foundational for understanding how the market moves. By recognizing where the market is trading at a premium (overvalued) versus a discount (undervalued), traders can make more informed decisions and align their strategies with institutional order flow.
Stay tuned as we break down how to identify these zones on a chart and how to incorporate them into your trading strategy. Make sure to like, subscribe, and turn on notifications so you never miss an update!
Happy Trading,
The_Architect

2025 ICT Mentorship: Institutional Market Structure Part 22025 ICT Mentorship: Lecture 3_Institutional Market Structure Part 2
Greetings Traders!
In Lecture 3 of the 2025 ICT Mentorship, we dive deep into the core principles of market structure, focusing on how institutions truly move the market. Understanding this is essential for precision trading and eliminating emotional biases.
Key Insights from the Lecture
🔹 Distinguishing Minor vs. Strong Swing Points – Learn to differentiate between structural noise and true market shifts.
🔹 Marking Market Structure with Precision – Objectively analyze price action to refine your decision-making process.
🔹 Institutional Market Structure Techniques – Align with smart money to enhance accuracy and consistency.
Why This Matters
Mastering market structure allows traders to anticipate price movement, reducing impulsive trades and reinforcing a disciplined approach. By integrating institutional strategies, we position ourselves for more accurate and confident executions.
Stay focused, keep refining your skills, and let’s continue elevating our trading game.
Institutional Market Structure Part 1:
Enjoy the video and happy trading!
The Architect 🏛️📊

Foundations of Mastery: 2025 Mentorship Begins!📢 Welcome to the 2025 Mentorship Program!
Greetings, Traders!
This is the first video of the 2025 Mentorship Program, where I’ll be releasing content frequently, diving deep into ICT concepts, and most importantly, developing structured models around them. My goal is to help you gain a deeper understanding of the market and refine your approach to trading.
Before we get started, I want to take a moment to speak to you directly.
💭 No matter where you are in your trading journey, I pray that you achieve—and even surpass—your goals this year.
📈 If you’re striving for consistency and discipline, may you reach new heights.
💡 If you’ve already found success, may you retain and refine your craft—because growth never stops.
🎯 If you’re just starting out, I pray you develop patience, discipline, and above all, accountability—because true progress comes when we own our failures and learn from them.
🔥 If you’ve been trading for years but still struggle with consistency, do not give up. The greatest adversity comes when you’re closest to success. Stay disciplined, stay dedicated, and keep pushing forward.
Above all, let this be a year where we grow together—not just as traders, but as individuals. May we foster humility, respect, and a learning environment where both experienced and new traders can share knowledge and thrive.
🙏 I pray over these things in the name of Jesus. Amen.
Let's have a great year!
The_Architect

Short Sellers: Liquidity Providers or Market Disruptors?█ Understanding Short Sellers: Liquidity Providers or Market Disruptors?
Short sellers often have a controversial reputation, viewed by many as market manipulators who profit from falling stock prices. However, recent research sheds light on an unexpected and valuable role they play: providing liquidity to the market, especially during critical moments like news releases. Let’s break down this concept in a way that’s approachable for everyone while maintaining the insights of the academic findings.
█ What Is Short Selling?
In simple terms, short selling is a trading strategy where an investor borrows shares of a stock, sells them, and hopes to buy them back later at a lower price to pocket the difference. While this might sound straightforward, it’s a high-risk activity because the potential losses are unlimited if the stock price rises instead of falling.
For long-term investors, the goal is usually to buy strong companies that will grow over time, benefiting from compounding returns and supporting broader economic growth. On the other hand, short selling tends to attract risk-seekers who aim to profit from price declines. Unfortunately, many inexperienced short sellers get burned by the complexities of market dynamics, including the balance of supply and demand for liquidity.
█ Why Is Short Selling Important?
Despite the risks, short sellers are essential to the financial markets. They help correct overpriced stocks and bring balance to valuations, contributing to more accurate pricing. Moreover, they provide critical insights during times of market euphoria or uncertainty.
One example of their importance is the role of short sellers during events like the “short squeezes” in GameStop or Volkswagen. These situations occur when a stock’s price skyrockets, often fueled by retail traders or unexpected news, forcing short sellers to buy back shares at higher prices. While dramatic, such events highlight the complex interaction between short selling and market liquidity.
█ A Fresh Perspective: Short Sellers as Liquidity Providers
Traditional thinking often casts short sellers as aggressive traders who demand liquidity—placing orders that consume existing bids or offers in the market. However, a recent study challenges this view, showing that some short sellers do the opposite: they provide liquidity.
Using transaction-level data, the study reveals that informed short sellers strategically supply liquidity by posting and maintaining limit orders. These orders help stabilize markets, especially during volatile periods like news days. This behavior contrasts with the common perception of short sellers as disruptive forces, instead positioning them as contributors to market efficiency.
█ Key Findings from the Research
The research, titled Stealthy Shorts: Informed Liquidity Supply, presents several critical insights:
⚪ Liquidity-Supplying vs. Liquidity-Demanding Short Sales:
Liquidity-supplying short sellers place limit orders, offering to sell shares at specific prices.
Liquidity-demanding short sellers use market orders, which take the best available prices.
The study found that liquidity-supplying short sales are more predictive of future stock returns than liquidity-demanding ones.
⚪ Predictive Power of Liquidity-Supplying Shorts:
Stocks with high levels of liquidity-supplying short sales underperform those with low levels over a 21-day holding period.
This pattern suggests that these short sellers have a long-term informational edge.
⚪ Impact on Price Discovery:
By providing liquidity, these short sellers help narrow bid-ask spreads, making it easier for other investors to enter or exit positions at favorable prices.
⚪ Informed Trading:
Liquidity-supplying short sellers often act on information not yet fully reflected in stock prices. For example, they are particularly active and accurate around news days when fresh information enters the market.
█ Implications for Investors and Regulators
The findings challenge regulators and market participants to rethink their views on short sellers. While short selling is often criticized for its potential to destabilize markets, this study highlights a more nuanced role: informed short sellers contribute to market liquidity and efficiency. For everyday investors, this means that short sellers aren’t just betting against companies but also helping ensure that stock prices reflect their true value over time.
█ Takeaways for Beginners
If you’re new to investing, here’s what you should know:
Short selling is risky and generally not recommended for beginners. The potential for unlimited losses makes it a strategy better suited for experienced traders.
Short sellers play a vital role in financial markets by helping correct mispricings and improving liquidity.
Understanding the mechanics of liquidity supply and demand can provide valuable insights into how markets function.
█ Final Thoughts
This research highlights the dual role of short sellers, particularly the most informed ones, as both traders and market stabilizers. By offering liquidity and acting on long-lived information, these traders help create more efficient markets, benefiting everyone from retail investors to large institutions. As always, a deeper understanding of market dynamics can empower better investment decisions and help you navigate the complexities of the financial world with confidence.
-----------------
Disclaimer
This is an educational study for entertainment purposes only.
The information in my Scripts/Indicators/Ideas/Algos/Systems does not constitute financial advice or a solicitation to buy or sell securities. I will not accept liability for any loss or damage, including without limitation any loss of profit, which may arise directly or indirectly from the use of or reliance on such information.
All investments involve risk, and the past performance of a security, industry, sector, market, financial product, trading strategy, backtest, or individual's trading does not guarantee future results or returns. Investors are fully responsible for any investment decisions they make. Such decisions should be based solely on evaluating their financial circumstances, investment objectives, risk tolerance, and liquidity needs.
My Scripts/Indicators/Ideas/Algos/Systems are only for educational purposes!

Choppy Market: Patience and Key Levels to WatchThis chart highlights a low-probability trading environment with corrective structures and low volatility. Key focus areas:
Upside Breakout: Watch for impulsive moves above the 30M trendline and 4H LQZ for short-term bullish setups.
Downside Correction: A steeper drop into the 15M or 1H LQZ may provide higher-probability long opportunities.
Stay Patient: Avoid trading inside the choppy range; wait for clear reactions at liquidity zones or strong breakouts with momentum.

Visualizing Liquidity in Retail PatternsIn this short video I go through a nice example of liquidity being engineered and raided on both sides of the market in order to facilitate a AMD/PO3 schematic.
I hope you find it insightful in how you view price, and how you can use retail patterns in order to fade the retail mindset.
- R2F

What Is ICT Turtle Soup, and How Can You Use It in Trading?What Is ICT Turtle Soup, and How Can You Use It in Trading?
The ICT Turtle Soup pattern is a strategic trading approach designed to exploit false breakouts in financial markets. By understanding and leveraging liquidity grabs, traders can identify potential reversals and enter trades with relative precision. This article delves into the components of the ICT Turtle Soup pattern, how to identify and use it, and its potential advantages and limitations, providing traders with valuable insights to potentially enhance their trading strategies.
The ICT Turtle Soup Pattern Explained
ICT Turtle Soup is a trading pattern developed by the Inner Circle Trader (ICT) that focuses on exploiting false breakouts in the market. This ICT price action strategy aims to identify and take advantage of situations where the price briefly moves beyond a key support or resistance level, only to reverse direction shortly after. This movement is often seen in ranging markets where prices oscillate between established highs and lows.
The concept behind ICT Turtle Soup trading is rooted in the idea of liquidity hunts and market imbalances. When the price breaks out, it often triggers stop-loss orders set by other traders, creating a temporary imbalance. The ICT Turtle Soup strategy seeks to capitalise on this by entering trades in the opposite direction once the breakout fails and the price returns to its previous range.
The pattern is named humorously after the original Turtle Traders' strategy, which focuses on genuine breakouts. In contrast, ICT Turtle Soup takes advantage of these failed attempts, thus "making soup out of turtles" by transforming unproductive breakout attempts into potentially effective trades.
Typically, traders look for specific signs of a false breakout, such as a price briefly moving above a recent high or below a recent low but failing to sustain the move. This strategy is particularly effective when used in conjunction with other ICT concepts, such as higher timeframe analysis and understanding of market structure.
Components of the ICT Turtle Soup Pattern
To effectively utilise the ICT Turtle Soup setup, it’s essential to understand its core components: order flow and market structure, liquidity, and internal versus external liquidity.
Order Flow and Market Structure
Order flow and market structure are critical in analysing the ICT Turtle Soup pattern. This involves observing price movements and traders' behaviour in different timeframes. Traders can analyse higher and lower timeframe price movements in FXOpen’s free TickTrader platform.
Higher Timeframe Structure
This refers to the broader trend governing the lower timeframe trend. For traders using the 15m-1h charts to trade, this might mean structure visible on 4-hour, daily, or weekly charts.
Higher timeframe structures help traders identify the major support and resistance levels. These levels are essential as they mark the boundaries within which the market generally oscillates. Traders use these to determine the prevailing market direction and potential areas where false breakouts (stop hunts) are likely to occur.
Lower Timeframe Structure
Lower timeframe structures are examined on hourly or minute charts. These provide a more detailed view of price action within the higher timeframe’s range and account for the bullish and bearish legs that dictate a broader higher timeframe trend.
Liquidity and Stop Hunts
In general trading terms, liquidity represents how easy it is to enter or exit a market. However, in the context of the ICT Turtle Soup pattern, areas of liquidity can be identified beyond key swing points.
Stop Hunts
Stop hunts, also known as a liquidity sweep, occur when the price temporarily moves above a resistance level or below a support level to trigger stop-loss orders. This movement creates a liquidity spike as traders' stops are hit, providing a favourable condition for the price to reverse direction. ICT Turtle Soup traders seek to exploit these moments by entering trades opposite to the initial breakout direction once the liquidity is absorbed.
Internal and External Liquidity
Understanding internal and external liquidity is vital for applying the ICT Turtle Soup pattern effectively.
Internal Liquidity
This refers to the liquidity available within the range of the higher timeframe structure. It involves identifying smaller support and resistance levels within the larger range. For example, in a bullish leg, there will be a series of higher highs and higher lows; beneath these higher lows is where internal liquidity rests. This internal liquidity will be targeted to form a bearish leg as part of a higher timeframe bullish trend.
External Liquidity
This involves liquidity that exists outside the key highs and lows of the higher timeframe trend. To use the example of the bullish leg in a higher timeframe bullish trend, the low it originated from and the high it creates as the bearish retracement begins count as areas of external liquidity.
Order Blocks and Imbalances
While not directly involved in the ICT Turtle Soup setup, understanding order blocks and imbalances can provide insight into where the price might head and the general market context.
Order blocks are areas where significant buying or selling activity has previously occurred, often due to institutional orders. These blocks represent zones of support and resistance where the price is likely to react.
Bullish Order Blocks
These are typically found at the base of a significant upward move and indicate zones where buying interest is strong. When the price revisits these areas, it often finds support, making them potential entry points for long trades.
Bearish Order Blocks
Conversely, these are located at the top of significant downward moves and signal strong selling interest. These zones often act as resistance when revisited, making them strategic points for short trades.
Imbalances
Imbalances, or fair value gaps (FVGs), are price regions where the market has moved too quickly, creating a significant disparity between the number of long and short trades. These gaps often occur due to high volatility and indicate areas where the market might revisit to "fill" the gap, thereby achieving fair value.
In other words, when a price rapidly moves in one direction, it leaves behind an area with little to no trading activity. The market often returns to these imbalanced zones to facilitate proper price discovery and liquidity.
How to Use the ICT Turtle Soup Strategy
Here's a detailed breakdown of how traders use the ICT Turtle Soup pattern.
Establishing a Bias
Traders begin by analysing the higher timeframe trend, such as the daily or weekly charts, to establish a market bias. This analysis helps determine whether the market is predominantly bullish or bearish. Identifying this trend is crucial as it guides where to look for potential Turtle Soup setups.
For instance, the example above shows AUDUSD initially moving down after a bullish movement off-screen. It eventually breaks above the lower high, indicating that the higher timeframe trend may now be bullish. Similarly, the shorter-term downtrend beginning from mid-May also saw a new high, meaning a trader may want to look for long positions.
Identifying Internal Liquidity
Once the higher timeframe trend is established, traders look for a move counter to that higher timeframe trend. In the example shown, this would be a downtrend counter to the bullish structure break. They mark levels of internal liquidity; in a bullish leg, these would be below swing lows and vice versa. These areas are likely to attract stop-loss orders.
Looking for Liquidity Taps
The next step involves waiting for these internal liquidity areas to be tapped. This typically happens when the price briefly breaks through a support or resistance level, triggering stop-loss orders before quickly reversing direction.
Ideally, the price should tap into the same area or order block where the internal liquidity formed and then exhibit a quick reversal, often leaving just a small wick. This movement indicates a liquidity grab, where large players have taken out stops to facilitate their own orders.
Lower Timeframe Confirmation
After identifying a liquidity grab beyond this internal liquidity level, traders look for an entry. On a lower timeframe, they look for a similar pattern: internal liquidity being run and a subsequent break of structure in the direction of the higher timeframe trend. This involves price retracing back inside the range to fill an imbalance and meet an order block, which provides a precise entry point.
Executing the Trade
Once these conditions are met, traders typically enter the market. Specifically, they’ll often leave a limit order at an order block to trade in the direction of the higher timeframe trend. They place a stop loss just beyond the liquidity grab, either above the recent high for a short trade or below the recent low for a long trade. Profit targets are often set at key liquidity levels, such as previous highs or lows, where the market is likely to encounter significant activity.
Potential Advantages and Limitations
The ICT Turtle Soup pattern is a trading strategy with several potential benefits and drawbacks.
Advantages
- Precision: Allows for precise entry points by identifying false breakouts and liquidity grabs.
- Adaptability: Effective across different timeframes and market conditions, including ranging and trending markets.
- Risk Management: Built-in risk management by placing stop losses just beyond the liquidity grab points.
Limitations
- Complexity: Requires a deep understanding of market structure, liquidity, and order flow, making it challenging for less experienced traders.
- Market Conditions: Less effective in highly volatile or illiquid markets where false signals are more common.
- Time-Consuming: Demands continuous monitoring of multiple timeframes to identify valid setups, which can be time-intensive.
The Bottom Line
The ICT Turtle Soup pattern offers traders a powerful tool to identify and exploit false breakouts in the market. By understanding its components and applying the strategy effectively, traders can potentially enhance their trading performance. To put this strategy into practice, consider opening an FXOpen account, a reliable broker that provides the necessary tools and resources for trading.
FAQs
What Is ICT Turtle Soup in Trading?
ICT Turtle Soup is a trading pattern that exploits false breakouts. It identifies potential reversals when the price briefly moves beyond a key support or resistance level, triggering stop-loss orders before reversing direction. This strategy aims to take advantage of these liquidity grabs by entering trades opposite to the initial breakout direction.
How to Identify ICT Turtle Soup Conditions?
To identify the ICT Turtle Soup pattern, traders analyse higher timeframe trends to establish market bias. They then look for counter-trend moves and mark internal liquidity areas. The pattern is identified when the price taps these liquidity zones and reverses quickly, often leaving a small wick. This signals a liquidity grab and potential trade setup in the direction of the higher timeframe trend.
How to Use the ICT Turtle Soup Pattern?
Using the ICT Turtle Soup pattern involves several steps. First, traders establish a market bias based on higher timeframe analysis. Then, they look for liquidity grabs at marked internal liquidity areas, indicating false breakouts. The next step is to confirm the setup on a lower timeframe by observing a similar liquidity grab and structure break. Lastly, they enter trades in the direction of the higher timeframe trend, placing stop losses just beyond the liquidity grab and targeting key liquidity levels for profit-taking.
This article represents the opinion of the Companies operating under the FXOpen brand only. It is not to be construed as an offer, solicitation, or recommendation with respect to products and services provided by the Companies operating under the FXOpen brand, nor is it to be considered financial advice.

4-Year Cycles [jpkxyz]Brief Introduction why Crypto moves in Cycles.
"Crypto is an expression of Macro."
The 2007-2008 global financial crisis was a pivotal moment that fundamentally transformed monetary policy, particularly in how central banks manage economic cycles through liquidity manipulation.
Before the crisis, central banks primarily used interest rates as a blunt instrument for economic management. The 2008 financial crisis exposed deep vulnerabilities in the global financial system, particularly the interconnectedness of financial institutions and the risks of unregulated credit markets.
In response, central banks, led by the Federal Reserve, developed a more sophisticated approach to economic management:
1. Quantitative Easing (QE)
The Federal Reserve introduced large-scale asset purchases, essentially creating money to buy government bonds and mortgage-backed securities. This unprecedented monetary intervention:
- Prevented a complete economic collapse
- Provided liquidity to frozen credit markets
- Kept interest rates artificially low
- Supported asset prices and prevented a deeper recession
2. Synchronized Global Monetary Policy
Central banks worldwide began coordinating their monetary policies more closely, creating a more interconnected approach to economic management:
- Coordinated interest rate decisions
- Shared information about economic interventions
- Created global liquidity pools
3. Cyclical Liquidity Management
The new approach involves deliberately creating and managing economic cycles through:
- Periodic liquidity injections
- Strategic interest rate adjustments
- Using monetary policy as a proactive economic tool rather than a reactive one
The 4-year cycle emerged as a pattern of:
- 2-3 years of expansionary policy
- Followed by a contraction or normalization period
This cycle typically involves:
- Expanding money supply
- Lowering interest rates
- Supporting asset prices
- Then gradually withdrawing support to prevent overheating
The 2007-2008 crisis essentially forced central banks to become more active economic managers, moving from a passive regulatory role to an interventionist approach that continuously adjusts monetary conditions.
This approach represents a significant departure from previous monetary policy, where central banks now see themselves as active economic architects rather than passive observers.

Understanding Liquidity in Financial Markets: A Beginner's GuideWhen you first start trading, you’ll often hear the term liquidity thrown around. But what does it really mean? Let’s break it down.
⚪ What is Liquidity?
Liquidity refers to how quickly and easily an asset can be bought or sold without causing a big change in its price. Think of it as the "smoothness" of trading. In liquid markets, there are plenty of buyers and sellers, so trades happen fast and at fair prices.
⚪ Why Does Liquidity Matter?
Fast Execution: High liquidity means you can enter and exit trades quickly, which is crucial for day traders and scalpers.
Fair Pricing: Liquid markets tend to have smaller gaps between the buying price (bid) and selling price (ask), so you’re less likely to overpay or undersell.
Market Stability: Liquidity reduces wild price swings, making markets more predictable and less risky for everyone.
⚪ How to Spot Liquidity
To gauge liquidity, watch for these signs:
High Trading Volume: The more people trading an asset, the more liquid it is.
Tight Bid-Ask Spread: If the difference between the buying and selling price is small, the market is likely liquid.
Quick Order Matching: In liquid markets, your orders are filled almost instantly.
⚪ Types of Liquidity
Market Liquidity: This is what we just discussed—how easily assets trade in the market.
Funding Liquidity: This refers to the ability of institutions or traders to raise cash quickly to meet obligations, like covering margin calls or seizing new opportunities.
⚪ The Role of Liquidity in Trading Strategies
For new traders, understanding liquidity can shape your strategy:
Day Traders and Scalpers: Focus on highly liquid markets. This ensures quick trade execution.
Swing Traders: Liquidity helps ensure that your trades aren't impacted by sudden price jumps, especially when entering or exiting larger positions.
Investors: Even for long-term traders, liquidity matters. If you hold an asset in a low-liquidity market, selling it later might be challenging without taking a loss.
⚪ How Low Liquidity Can Impact You
Imagine trying to sell a rare collectible car. If no one’s buying, you may have to lower your price significantly to find a buyer. The same happens in financial markets. In low-liquidity conditions:
Prices can become volatile.
Orders take longer to fill.
You may not get the price you expected.
⚪ Hidden Dimensions of Liquidity
Liquidity and Market Efficiency
Efficient markets are typically more liquid. High liquidity ensures that prices reflect all available information, reducing opportunities for arbitrage. For traders, this means less "free lunch" but also fewer surprises.
The Illusion of Liquidity
Not all liquidity is equal. In quiet markets, liquidity may appear sufficient, but during high volatility (like after news releases), the illusion fades. Flash crashes often occur when liquidity evaporates unexpectedly, leaving traders trapped.
Liquidity and Risk Management
Stop-Loss Orders: In illiquid markets, stop-loss orders might not execute at the intended price, leading to "gapping" losses.
Position Sizing: Traders must adjust their position size in less liquid markets to avoid disproportionate impact on price.
⚪ Liquidity in the Bigger Picture
Liquidity isn't just a trading term; it's the backbone of the entire financial system. Without liquidity:
Markets can seize up during crises (like in 2008).
Institutions might fail to meet obligations.
Overall confidence in the financial system can waver.
For traders, this emphasizes the importance of staying aware of market conditions and choosing the right assets to trade.
⚪ Key Takeaway
As a new trader, always prioritize liquidity when choosing what to trade. It’s like choosing a highway with less traffic—you’ll reach your destination faster and with fewer surprises. Over time, understanding liquidity will become second nature, helping you navigate the markets more effectively.
Disclaimer: This information is for entertainment purposes only and does not constitute financial advice. Please consult with a qualified financial advisor before making any investment decisions.

MY APPROACH TO MAKING MONEYMy main trading principle is that the price always moves from swept liquidity levels to untouched liquidity levels by forming structure on the way.
Liquidity and Structure is a key for my trading system.

What is liquidityLiquidity is the market's fuel to run the market further market drives from internal liquidity to external liquidity which is also called ERLIRL in short form it's the place where most of the stop loss get hunts and market shift to opposite direction

HOW And WHY The Markets MoveIn this video I explain HOW and WHY the markets move.
At it's core, trading is a zero-sum game, meaning that nothing is created. There must always be a counter-party to any trade, after all it is called "trading". Because of this, liquidity is the lifeblood of the market and it is what is required by all participants, albeit more for the larger entities out there. In order for these larger entities to trade, they must do so in stages of buying and selling, and not all in one single position like we do as retail traders. They buy on the way down, and sell on the way up, throughout many different time horizons. Therefore, they require price to be delivered efficiently in order to sustain this working machine.
I hope you find the video somewhat insightful. Regardless of your beliefs, I think it can be agreed that these two principles are what drives the marketplace and it's movements.
- R2F

Uptrend or Fadeout? Learn the Key to Catching Market Breakouts1. Recognizing Market Structures: Uptrends and Downtrends
Higher Highs (HH) and Higher Lows (HL):
These are signs the market is in an uptrend—prices keep moving up, forming new highs (peaks) and lows (dips) that are higher than the previous ones.
Think of it like climbing stairs: each step higher shows the market’s strength.
Lower Highs (LH) and Lower Lows (LL):
When prices stop climbing and start forming lower peaks and lower dips, it signals that the market might be slowing down or reversing into a downtrend.
In the chart:
The first part shows a bullish (upward) move with Higher Highs and Higher Lows.
Later, the market shifts to lower highs, signaling a potential slowdown or shift toward a downward move.
2. What Is the LQZ (Liquidity Zone)?
Liquidity Zone (LQZ): This is a key price area where a lot of trading activity happens—like a hotspot where buyers and sellers clash.
When price reaches such a zone, it either breaks through and keeps moving in that direction (bullish continuation) or bounces back down (rejection).
Think of it like a soccer goal line: if the ball crosses the line, the team scores a goal (bullish move); if it’s blocked, the ball goes the other way (bearish move).
In the chart:
The LQZ is highlighted as the key level to watch. A clean breakout (with more than just a quick spike or wick) signals that buyers are strong enough to push the market higher.
If the price gets rejected at this zone, the sellers regain control, and the market might move down.
3. Scenarios: What Happens Next?
The chart offers two possible outcomes based on how price behaves near the LQZ.
Bullish Scenario:
If the price breaks above the LQZ and stays there, it’s likely to continue upward towards:
Target 1: 2,661.38
Target 2: 2,673.60
These are the next levels where buyers might take profits or where new sellers could appear.
Bearish Scenario:
If the price gets rejected at the LQZ and drops lower, it could move towards:
Bearish Target 1: 2,569.49
Bearish Target 2: 2,546.25
This suggests the sellers have taken control, pushing the market down.
4. How to Know When to Enter a Trade?
The chart highlights the importance of waiting for confirmation before jumping into a trade. Here’s a simple trade plan:
For a Buy (Long) Trade:
Wait until the price breaks above the LQZ and stays above it.
Enter on the first pullback (dip) after the breakout—this is often called a flag or retest.
For a Sell (Short) Trade:
If the price gets rejected at the LQZ, wait for a clear downward movement.
Enter after the first lower high forms, confirming that the sellers are in control.
Why wait for confirmation?
Jumping in too early might cause you to get caught in a false breakout or fake move. Think of it like waiting to see which team scores first before betting on the game.
5. Avoid Emotional Trading and Manage Risk
This chart reflects a key lesson: trading is a game of patience and probabilities.
If the trade doesn't go as expected, it’s important to step back and wait for the next opportunity.
Don’t chase trades just because you fear missing out (FOMO). You might enter too soon and hit your stop loss unnecessarily.
Risk Management Tip:
Use stop losses to protect your account from big losses.
Avoid placing multiple risky trades on the same pair just because you’re impatient. It’s better to wait for high-probability setups.
6. Summary: A Simple Trading Plan
Watch the LQZ level:
If the price breaks above, look to buy on the next dip.
If the price gets rejected, look to sell when it starts forming lower highs.
Set Clear Targets:
For bullish trades, aim for Target 1 and 2 above.
For bearish trades, aim for Bearish Targets 1 and 2 below.
Don’t Rush:
Wait for clear confirmation before entering.
Follow your trading plan and avoid emotional decisions.
