INVITE-ONLY SCRIPT
Rova MTF SMI Minute
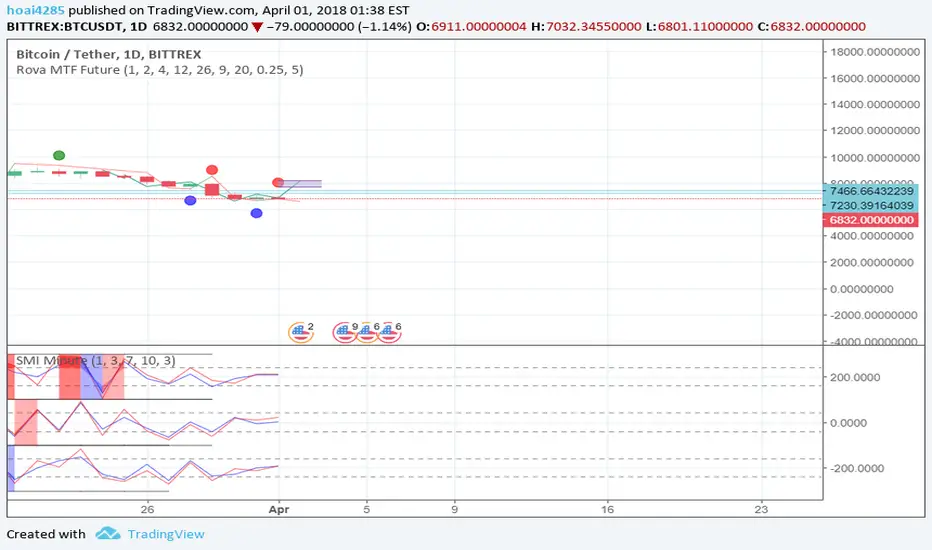
Stochastic Momentum Index is used to find oversold and overbought zones. It also helps to figure out whether to enter short trade or long trade.
Red Shade in the Top indicates that the stock is oversold and the Blue shade in the bottom indicates overbought.
The lighter color indicates that the trend is continuing while the darker color indicates the trend is reversing.
This indicator shows 3 Stochastic Momentum Index of 3 different Time Frames (with 1 minute as their base resolution) in one windows.
Invite-only script
Access to this script is restricted to users authorized by the author and usually requires payment. You can add it to your favorites, but you will only be able to use it after requesting permission and obtaining it from its author. Contact hoai4285 for more information, or follow the author's instructions below.
Please note that this is a private, invite-only script that was not analyzed by script moderators. Its compliance to House Rules is undetermined. TradingView does not suggest paying for a script and using it unless you 100% trust its author and understand how the script works. In many cases, you can find a good open-source alternative for free in our Community Scripts.
Want to use this script on a chart?
Warning: please read before requesting access.
Disclaimer
The information and publications are not meant to be, and do not constitute, financial, investment, trading, or other types of advice or recommendations supplied or endorsed by TradingView. Read more in the Terms of Use.