INVITE-ONLY SCRIPT
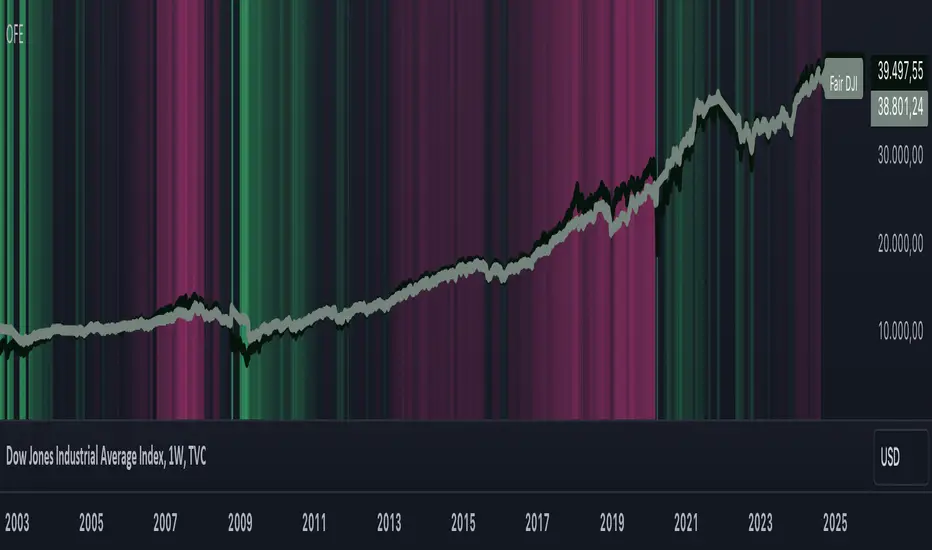
Oster's Fair Economy (OFE)
Updated
Overview:
Oster's Fair Economy (OFE) is a powerful tool designed to give traders and investors a comprehensive assessment of the fair value of major stock indices. Unlike conventional indicators that focus solely on technical analysis, OFE emphasizes economic metrics to offer a deeper understanding of the market's intrinsic value. By applying Oster's method (explained below), OFE determines the fundamental fair price of key indices, making it an invaluable tool for top-down analysis and market confirmation. It is particularly useful for swing trading on indices and as a top-down confirmation for individual stock trades.
Important Note:
Innovative Approach to Economic Analysis:
OFE integrates a unique combination of key economic metrics, including:
These metrics are tailored for 20 different markets: United States (US), Canada (CA), European Union (EU), Germany (DE), United Kingdom (GB), France (FR), Italy (IT), Switzerland (CH), Spain (ES), Australia (AU), New Zealand (NZ), Japan (JP), China (CN), Hong Kong (HK), South Korea (KR), India (IN), Russia (RU), Brazil (BR), Mexico (MX), and Saudi Arabia (SA).
This comprehensive set of data allows traders to gauge the potential for growth, inflation, and overall market conditions. OFE's weighting system reflects the importance of these metrics in determining the fair value of indices according to Oster's methodology.
How OFE Works:
OFE's calculation methodology is designed to provide insights into whether an index is fundamentally overvalued, undervalued, or trading at fair value by comparing its price dynamics with economic data. Here’s a step-by-step breakdown of how OFE works:
Customizable Parameters for Tailored Analysis:
OFE offers extensive customization options to align with your specific investment strategy. Users can:
Additionally, users can compare different indices with various macroeconomic data sets. For example, you might select the DAX index and apply US economic data to see how the index would perform if driven by US market fundamentals. This feature enables a highly tailored and region-specific analysis, empowering traders to align OFE with their individual perspectives and market outlooks.
Interpretation:
If the calculated fair price is above the current index value, the index is considered fundamentally undervalued, indicating potential for price increases. Conversely, if the fair price is below the current index value, the index is seen as overvalued, suggesting potential risks or a possible correction. The fair price acts as a gravitational force, pulling the index toward its true economic value over time.
This over- or undervaluation can also serve as an overarching economic confirmation for stock trading. For example, it might be advantageous to buy individual stocks when the broader market is fundamentally undervalued, as the general upward potential of the market could support stock price increases. Conversely, selling or avoiding stocks when the broader market is overvalued could help mitigate potential risks, as the market may be primed for a correction.
Conclusion:
Oster's Fair Economy (OFE) bridges the gap between technical simplicity and the depth of macroeconomic analysis. By integrating complex economic metrics with user-friendly customization, OFE empowers traders and investors to assess the fair valuation of indices confidently. This tool is ideal for confirming market trends and gaining a broader understanding of the economic landscape, making it a valuable asset in any investment toolkit.
Oster's Fair Economy (OFE) is a powerful tool designed to give traders and investors a comprehensive assessment of the fair value of major stock indices. Unlike conventional indicators that focus solely on technical analysis, OFE emphasizes economic metrics to offer a deeper understanding of the market's intrinsic value. By applying Oster's method (explained below), OFE determines the fundamental fair price of key indices, making it an invaluable tool for top-down analysis and market confirmation. It is particularly useful for swing trading on indices and as a top-down confirmation for individual stock trades.
Important Note:
- OFE is designed for use with indices, not individual stocks: Stocks are often driven by their own fundamental factors, such as earnings, revenue, and dividend yields, which may not align with broad economic metrics. While OFE can sometimes provide insights into individual stocks, particularly those highly correlated with broader market trends, it is specifically intended for index analysis.
- OFE is optimized for Weekly Candles (W): OFE is most effective when used with weekly data, as it aligns with the longer-term outlook of economic analyses. While it can be used with smaller timeframes, weekly data is recommended for the most accurate insights.
Innovative Approach to Economic Analysis:
OFE integrates a unique combination of key economic metrics, including:
- Gross National Product (GNP)
- Consumer Price Index (CPI)
- Unemployment Rate (UR)
- Interest Rate (e.g., FED)
- Nonfarm Payrolls (NFP)
- Retail Sales (RS)
- Industrial Production (IP)
- Balance Of Trade (BOT)
- Money Supply M2 (M2)
- Consumer Confidence Index (CCI)
These metrics are tailored for 20 different markets: United States (US), Canada (CA), European Union (EU), Germany (DE), United Kingdom (GB), France (FR), Italy (IT), Switzerland (CH), Spain (ES), Australia (AU), New Zealand (NZ), Japan (JP), China (CN), Hong Kong (HK), South Korea (KR), India (IN), Russia (RU), Brazil (BR), Mexico (MX), and Saudi Arabia (SA).
This comprehensive set of data allows traders to gauge the potential for growth, inflation, and overall market conditions. OFE's weighting system reflects the importance of these metrics in determining the fair value of indices according to Oster's methodology.
How OFE Works:
OFE's calculation methodology is designed to provide insights into whether an index is fundamentally overvalued, undervalued, or trading at fair value by comparing its price dynamics with economic data. Here’s a step-by-step breakdown of how OFE works:
- Economic Data Collection: OFE retrieves relevant economic data from the selected region, such as GDP, CPI, and interest rates. If specific market data is unavailable, OFE defaults to the US market as a fallback.
- Normalization and Weighting: The collected economic metrics are normalized against historical trends to ensure that the data reflects both current levels and long-term averages. For example, GDP growth rates are normalized based on historical data, allowing for a comparison across different economic periods. Similarly, CPI and unemployment rates are adjusted to account for historical context, ensuring that high inflation or unemployment is appropriately weighed relative to past conditions. However, all other macroeconomic key figures are also processed in the same way.
- Relating Economic Metrics to Price Dynamics: OFE calculates specific ratios by comparing the selected index’s price with the normalized economic data. These ratios, such as the GNP ratio, are then analyzed within the context of historical performance. The goal is to establish a relationship between the economic indicators and the index’s historical price behavior. For instance, if the GNP ratio is currently higher than historical norms, it could suggest that the index is overvalued relative to the economy’s actual productivity.
- Fair Value Calculation: Based on the derived ratios and their historical correlations with index prices, OFE computes a fair value for the index. This calculation integrates multiple economic indicators, each weighted according to its perceived importance in influencing the index. For example, in a high-growth environment, GDP and industrial production might carry more weight, whereas in a recession, unemployment and interest rates could become more influential. The resulting fair value reflects the index's price adjusted for the current economic environment.
- Price Comparison: The calculated fair value is then compared to the current market price of the index. If the market price significantly deviates from the fair value, it suggests that the index is either overvalued or undervalued. For example, if the fair value of the S&P 500 is calculated to be 10% lower than its current market price, OFE would indicate that the index might be overvalued, potentially signaling a market correction. The fair price line basically acts as a kind of magnet that keeps attracting the index price. This is because, in the longer term, the broad market is always guided by the economic health of the country in concerned.
- Market Dynamics Consideration: By adjusting the "Strictness" level in OFE, users can control how sensitive the fair value calculation is to economic fundamentals. A higher strictness level would highlight discrepancies between the fair value and the market price more aggressively, suggesting a higher likelihood of market mispricing. Conversely, a lower strictness level allows for greater flexibility, acknowledging that markets can sometimes deviate from fundamental values without immediate correction.
Customizable Parameters for Tailored Analysis:
OFE offers extensive customization options to align with your specific investment strategy. Users can:
- Select or deselect economic metrics for inclusion.
- Adjust the weighting of each metric to reflect its importance in their analysis.
- Fine-tune the strictness of the valuation process (as explained above).
Additionally, users can compare different indices with various macroeconomic data sets. For example, you might select the DAX index and apply US economic data to see how the index would perform if driven by US market fundamentals. This feature enables a highly tailored and region-specific analysis, empowering traders to align OFE with their individual perspectives and market outlooks.
Interpretation:
If the calculated fair price is above the current index value, the index is considered fundamentally undervalued, indicating potential for price increases. Conversely, if the fair price is below the current index value, the index is seen as overvalued, suggesting potential risks or a possible correction. The fair price acts as a gravitational force, pulling the index toward its true economic value over time.
This over- or undervaluation can also serve as an overarching economic confirmation for stock trading. For example, it might be advantageous to buy individual stocks when the broader market is fundamentally undervalued, as the general upward potential of the market could support stock price increases. Conversely, selling or avoiding stocks when the broader market is overvalued could help mitigate potential risks, as the market may be primed for a correction.
Conclusion:
Oster's Fair Economy (OFE) bridges the gap between technical simplicity and the depth of macroeconomic analysis. By integrating complex economic metrics with user-friendly customization, OFE empowers traders and investors to assess the fair valuation of indices confidently. This tool is ideal for confirming market trends and gaining a broader understanding of the economic landscape, making it a valuable asset in any investment toolkit.
Release Notes
changed default values and stylingInvite-only script
Access to this script is restricted to users authorized by the author and usually requires payment. You can add it to your favorites, but you will only be able to use it after requesting permission and obtaining it from its author. Contact patrick_oster for more information, or follow the author's instructions below.
Please note that this is a private, invite-only script that was not analyzed by script moderators. Its compliance to House Rules is undetermined. TradingView does not suggest paying for a script and using it unless you 100% trust its author and understand how the script works. In many cases, you can find a good open-source alternative for free in our Community Scripts.
Author's instructions
″If you are interested in the indicator, just send me a private message and I'll give you a short test access to test it out.
Want to use this script on a chart?
Warning: please read before requesting access.
Disclaimer
The information and publications are not meant to be, and do not constitute, financial, investment, trading, or other types of advice or recommendations supplied or endorsed by TradingView. Read more in the Terms of Use.