INVITE-ONLY SCRIPT
Support Resistance HH HL LH LL
Updated

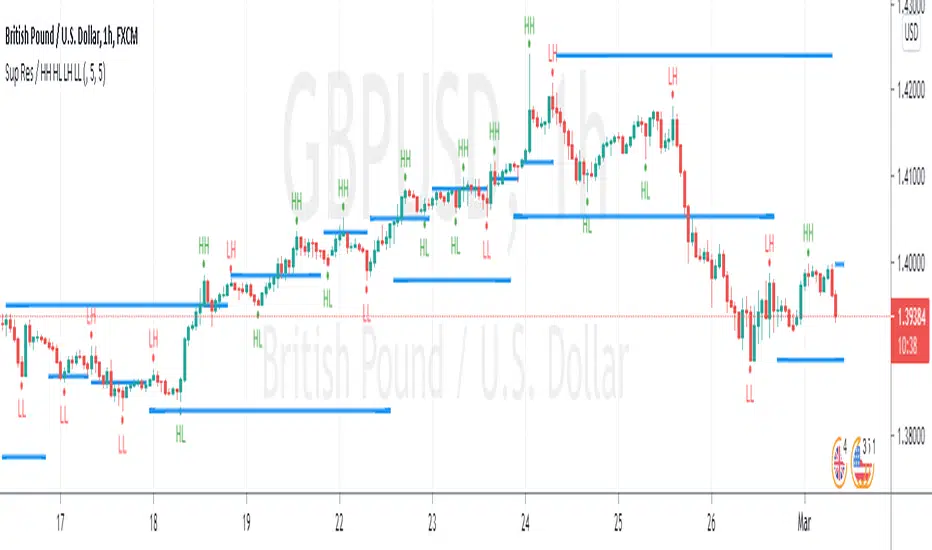
This is a very powerful indicator and I'm really happy to show you how it works.
It shows Higher Highs(HH),Higher Lows(HL),Lower Highs(LH),and Lower Lows (LL), the supports and the resistance.
Lets start with the HH, HL, LH and LL.
This points helps a lot who can not identify them yet. They help to identify up trends having HH and HL in sequence, and when the trend is not strong anymore creating LH after.
For down trends, the indicator show LH and LL in sequence and when the trend is not strong anymore showing HL after.
As well this indicator helps to draw trend lines when it shows. For example the LL drawing the line from the low of the first candle (LL) to the low of the second candle showing HL for an uptrend.
It can be done for the down trend, drawing the trend line from the high of the candle showing the HH, to the high of the candle showing LH.
Another use of the HH, HL, LH, LL can be the stop loss this will be explained later in the support and resistance part.
Now let me explain the support and resistance.
The support and resistance can be used as entry when the price break true using the previous HH, HL, LH and LL as stop loss.
For a safer entry I advise to use the retest of the line.
In the settings of the indicator there is the possibility to make the indicators invisible, to change the color, and as well to change how many candles before and after the main candle showing the HH, HL, LH and LL, but I advise to leave it as it is.
Thank you and lets take some pips!
Release Notes
there was a typing mistake on the show HH HL LH LL on settingRelease Notes
Changed the minimum value can be set to have more HH HL LH LLRelease Notes
Now it s possible to change the resolution on the lines and the colorRelease Notes
Changed default as 4 hoursRelease Notes
a quick update on the resolution that now stays in the same time frame but still has the option to change itRelease Notes
fixed mistypeRelease Notes
fixed resolution optionInvite-only script
Access to this script is restricted to users authorized by the author and usually requires payment. You can add it to your favorites, but you will only be able to use it after requesting permission and obtaining it from its author. Contact Itakepips for more information, or follow the author's instructions below.
TradingView does not suggest paying for a script and using it unless you 100% trust its author and understand how the script works. In many cases, you can find a good open-source alternative for free in our Community Scripts.
Author's instructions
″Please check on setting on input you are able to change the resolution of the lines.
still on settings you have the possibility to change color on the support and restistance lines.
For any queries please don t hesitate to contact me.
Want to use this script on a chart?
Warning: please read before requesting access.
Disclaimer
The information and publications are not meant to be, and do not constitute, financial, investment, trading, or other types of advice or recommendations supplied or endorsed by TradingView. Read more in the Terms of Use.